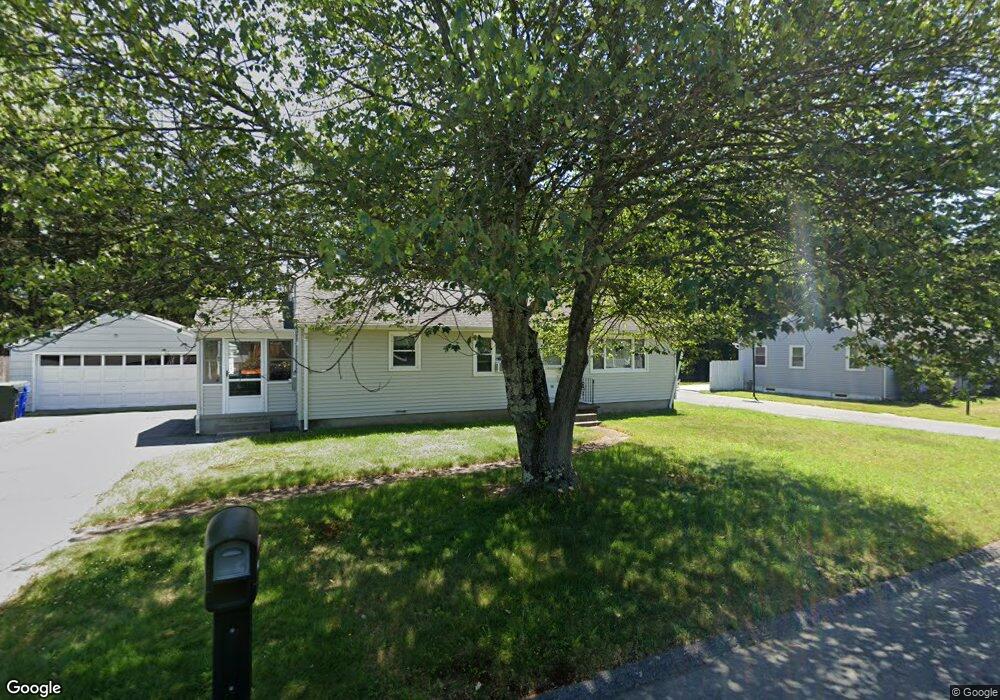
118 Bulat Dr Springfield, MA 01129
Boston Road NeighborhoodEstimated Value: $273,000 - $331,000
3
Beds
1
Bath
1,092
Sq Ft
$277/Sq Ft
Est. Value
About This Home
This home is located at 118 Bulat Dr, Springfield, MA 01129 and is currently estimated at $301,946, approximately $276 per square foot. 118 Bulat Dr is a home located in Hampden County with nearby schools including Warner, M Marcus Kiley Middle, and Springfield Central High School.
Ownership History
Date
Name
Owned For
Owner Type
Purchase Details
Closed on
May 21, 2007
Sold by
Tracy Mark D and Tracy Robin Ann
Bought by
Tracy Mark D
Current Estimated Value
Home Financials for this Owner
Home Financials are based on the most recent Mortgage that was taken out on this home.
Original Mortgage
$119,031
Interest Rate
6.18%
Mortgage Type
Purchase Money Mortgage
Purchase Details
Closed on
Sep 27, 1985
Bought by
Tracy Mark D
Create a Home Valuation Report for This Property
The Home Valuation Report is an in-depth analysis detailing your home's value as well as a comparison with similar homes in the area
Home Values in the Area
Average Home Value in this Area
Purchase History
| Date | Buyer | Sale Price | Title Company |
|---|---|---|---|
| Tracy Mark D | -- | -- | |
| Tracy Mark D | $64,000 | -- |
Source: Public Records
Mortgage History
| Date | Status | Borrower | Loan Amount |
|---|---|---|---|
| Open | Tracy Mark D | $122,500 | |
| Closed | Tracy Mark D | $119,031 | |
| Previous Owner | Tracy Mark D | $59,200 | |
| Previous Owner | Tracy Mark D | $20,000 | |
| Previous Owner | Tracy Mark D | $51,200 |
Source: Public Records
Tax History
| Year | Tax Paid | Tax Assessment Tax Assessment Total Assessment is a certain percentage of the fair market value that is determined by local assessors to be the total taxable value of land and additions on the property. | Land | Improvement |
|---|---|---|---|---|
| 2025 | $4,310 | $274,900 | $58,400 | $216,500 |
| 2024 | $4,119 | $256,500 | $58,400 | $198,100 |
| 2023 | $3,874 | $227,200 | $55,600 | $171,600 |
| 2022 | $3,992 | $212,100 | $55,600 | $156,500 |
| 2021 | $3,623 | $191,700 | $50,500 | $141,200 |
| 2020 | $3,525 | $180,500 | $50,500 | $130,000 |
| 2019 | $3,245 | $164,900 | $50,500 | $114,400 |
| 2018 | $3,290 | $167,200 | $50,500 | $116,700 |
| 2017 | $3,185 | $162,000 | $45,500 | $116,500 |
| 2016 | $2,969 | $151,000 | $45,500 | $105,500 |
| 2015 | $3,027 | $153,900 | $45,500 | $108,400 |
Source: Public Records
Map
Nearby Homes
Your Personal Tour Guide
Ask me questions while you tour the home.