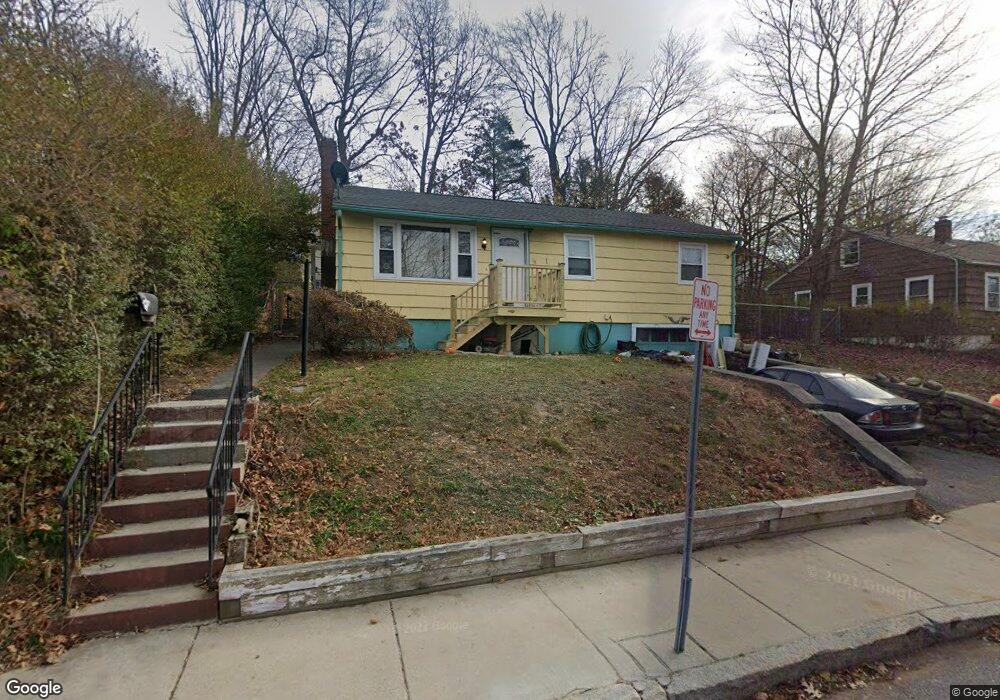
118 Byron Ave Lawrence, MA 01841
Tower Hill NeighborhoodEstimated Value: $449,000 - $536,000
2
Beds
1
Bath
1,104
Sq Ft
$445/Sq Ft
Est. Value
About This Home
This home is located at 118 Byron Ave, Lawrence, MA 01841 and is currently estimated at $491,224, approximately $444 per square foot. 118 Byron Ave is a home located in Essex County with nearby schools including Olive Branch Elementary School, Gerard A. Guilmette School, and School For Exceptional Studies.
Ownership History
Date
Name
Owned For
Owner Type
Purchase Details
Closed on
Nov 18, 2010
Sold by
Lantigua Selsa A Maria
Bought by
Scudder Bay Capital Ll
Current Estimated Value
Purchase Details
Closed on
Nov 27, 2006
Sold by
Santiago Selsa
Bought by
Lantigua Selsa A
Home Financials for this Owner
Home Financials are based on the most recent Mortgage that was taken out on this home.
Original Mortgage
$242,750
Interest Rate
6.39%
Mortgage Type
Purchase Money Mortgage
Purchase Details
Closed on
Oct 29, 2004
Sold by
Clark Robert A
Bought by
Santiago Selsa
Purchase Details
Closed on
Aug 13, 1999
Sold by
Kirkman Thomas A
Bought by
Clark Robert A
Create a Home Valuation Report for This Property
The Home Valuation Report is an in-depth analysis detailing your home's value as well as a comparison with similar homes in the area
Home Values in the Area
Average Home Value in this Area
Purchase History
| Date | Buyer | Sale Price | Title Company |
|---|---|---|---|
| Scudder Bay Capital Ll | $96,574 | -- | |
| Lantigua Selsa A | -- | -- | |
| Lantigua Selsa A | -- | -- | |
| Santiago Selsa | $215,000 | -- | |
| Clark Robert A | $115,900 | -- | |
| Scudder Bay Capital Ll | $96,574 | -- | |
| Lantigua Selsa A | -- | -- | |
| Santiago Selsa | $215,000 | -- | |
| Clark Robert A | $115,900 | -- |
Source: Public Records
Mortgage History
| Date | Status | Borrower | Loan Amount |
|---|---|---|---|
| Previous Owner | Lantigua Selsa A | $242,750 |
Source: Public Records
Tax History Compared to Growth
Tax History
| Year | Tax Paid | Tax Assessment Tax Assessment Total Assessment is a certain percentage of the fair market value that is determined by local assessors to be the total taxable value of land and additions on the property. | Land | Improvement |
|---|---|---|---|---|
| 2025 | $3,551 | $403,500 | $138,800 | $264,700 |
| 2024 | $3,467 | $374,800 | $134,200 | $240,600 |
| 2023 | $3,486 | $343,100 | $117,500 | $225,600 |
| 2022 | $3,418 | $298,800 | $109,200 | $189,600 |
| 2021 | $3,254 | $265,200 | $109,200 | $156,000 |
| 2020 | $3,090 | $248,600 | $92,600 | $156,000 |
| 2019 | $3,000 | $219,300 | $80,100 | $139,200 |
| 2018 | $2,785 | $194,500 | $76,600 | $117,900 |
| 2017 | $2,695 | $175,700 | $73,900 | $101,800 |
| 2016 | $2,508 | $161,700 | $52,500 | $109,200 |
| 2015 | $2,445 | $161,700 | $52,500 | $109,200 |
Source: Public Records
Map
Nearby Homes
- 68 Middlebury St
- 14-16 Cypress Ave
- 88-90 Columbus Ave
- 57 Strathmore Rd
- 265 Ames St
- 32 Glen Ave
- 2 Maurice Ave
- 47 Hallenan Ave
- 1008 Essex St Unit 1010
- 30-32 Linden St
- 450 Riverside Dr Unit 1
- 439-443 Riverside Dr
- 18 Ames St
- 70 Butler St
- 62-66 Butler St
- 2 Glen Forest Ln
- 44-46 Butler St
- 945 Riverside Dr Unit 2A
- 134 Haverhill St
- 8 Francella Rd
- 118 Byron Ave
- 122 Byron Ave
- 114 Byron Ave
- 161 Olive Ave
- 165 Olive Ave
- 137 Byron Ave
- 137 Byron Ave Unit 137
- 135 Byron Ave
- 159 Olive Ave
- 130 Byron Ave
- 110 Byron Ave
- 167 Olive Ave
- 169 Olive Ave
- 141 Byron Ave
- 3 Perry Ave
- 3 Perry Ave Unit 3
- 3 Perry Ave Unit 1
- 1 Perry Ave
- 171 Olive Ave Unit B
- 171 Olive Ave