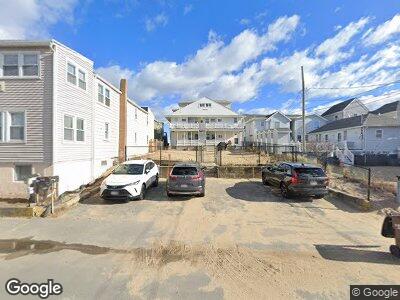
118 Central Ave Unit 1 Salisbury, MA 01952
Estimated Value: $492,000 - $795,000
3
Beds
1
Bath
855
Sq Ft
$675/Sq Ft
Est. Value
About This Home
This home is located at 118 Central Ave Unit 1, Salisbury, MA 01952 and is currently estimated at $576,745, approximately $674 per square foot. 118 Central Ave Unit 1 is a home located in Essex County with nearby schools including Triton Regional High School.
Ownership History
Date
Name
Owned For
Owner Type
Purchase Details
Closed on
Dec 2, 2010
Sold by
Matarese John and Matarese Hazel
Bought by
Matarese Tr John and Matarese Hazel
Current Estimated Value
Purchase Details
Closed on
Dec 22, 2008
Sold by
Drivas Cathleen E and Drivas Peter M
Bought by
Matarese Hazel and Matarese John
Home Financials for this Owner
Home Financials are based on the most recent Mortgage that was taken out on this home.
Original Mortgage
$235,900
Interest Rate
6.27%
Mortgage Type
Purchase Money Mortgage
Purchase Details
Closed on
Apr 21, 2005
Sold by
Lombari Joseph W
Bought by
Drivas Cathleen E and Drivas Peter M
Home Financials for this Owner
Home Financials are based on the most recent Mortgage that was taken out on this home.
Original Mortgage
$210,000
Interest Rate
5.87%
Mortgage Type
Purchase Money Mortgage
Purchase Details
Closed on
Apr 25, 1994
Sold by
Rasimowicz Stanley R and Rasimowicz Dianna
Bought by
Saracusa Henry S and Saracusa Frances T
Create a Home Valuation Report for This Property
The Home Valuation Report is an in-depth analysis detailing your home's value as well as a comparison with similar homes in the area
Home Values in the Area
Average Home Value in this Area
Purchase History
| Date | Buyer | Sale Price | Title Company |
|---|---|---|---|
| Matarese Tr John | -- | -- | |
| Matarese Hazel | $294,900 | -- | |
| Matarese Hazel | $294,900 | -- | |
| Drivas Cathleen E | $337,000 | -- | |
| Drivas Cathleen E | $337,000 | -- | |
| Saracusa Henry S | $124,601 | -- |
Source: Public Records
Mortgage History
| Date | Status | Borrower | Loan Amount |
|---|---|---|---|
| Previous Owner | Matarese Hazel | $235,900 | |
| Previous Owner | Drivas Cathleen E | $60,000 | |
| Previous Owner | Drivas Cathleen E | $210,000 |
Source: Public Records
Tax History Compared to Growth
Tax History
| Year | Tax Paid | Tax Assessment Tax Assessment Total Assessment is a certain percentage of the fair market value that is determined by local assessors to be the total taxable value of land and additions on the property. | Land | Improvement |
|---|---|---|---|---|
| 2025 | $4,980 | $494,000 | $0 | $494,000 |
| 2024 | $4,621 | $442,200 | $0 | $442,200 |
| 2023 | $4,519 | $418,400 | $0 | $418,400 |
| 2022 | $4,342 | $389,800 | $0 | $389,800 |
| 2021 | $4,137 | $367,400 | $0 | $367,400 |
| 2020 | $4,051 | $353,500 | $0 | $353,500 |
| 2019 | $4,050 | $341,500 | $0 | $341,500 |
| 2018 | $3,774 | $320,400 | $0 | $320,400 |
| 2017 | $3,674 | $308,200 | $0 | $308,200 |
| 2016 | $3,597 | $308,200 | $0 | $308,200 |
| 2015 | $3,586 | $305,200 | $0 | $305,200 |
Source: Public Records
Map
Nearby Homes
- 117 Central Ave
- 116 N End Blvd Unit A
- 127 N End Blvd
- 127 N End Blvd Unit 1
- 127 N End Blvd Unit 2
- 77 N End Blvd
- 77 N End Blvd Unit 2
- 77 N End Blvd Unit 1
- 38-40 Central Ave
- 154 North End Blvd
- 29 Central Ave
- 7 Shea St Unit 4
- 5 Shea St Unit 2
- Lot 18 Map 16
- 224 N End Blvd Unit B-1
- 1 Atlantic Ave Unit 1
- 85 Atlantic Ave Unit 3
- 76 N End Blvd
- 114 Railroad Ave
- 170 Beach Rd Unit 41
- 118 Central Ave Unit 4
- 118 Central Ave Unit 3
- 118 Central Ave Unit 2
- 118 Central Ave Unit 1
- 144 Central Ave
- 116 Central Ave Unit 3
- 116 Central Ave Unit 1
- 116 Central Ave Unit BLDG1
- 116 Central Ave Unit 2
- 116 Central Ave Unit A-4
- 116 Central Ave Unit B-1
- 116 Central Ave Unit 4
- 116 Central Ave
- 116 UNIT A Central Ave Ave
- 130 Central Ave
- 108 Central Ave
- 136 Central Ave
- 102 Central Ave Unit 2
- 102 Central Ave Unit 1
- 102 Central Ave Unit 3