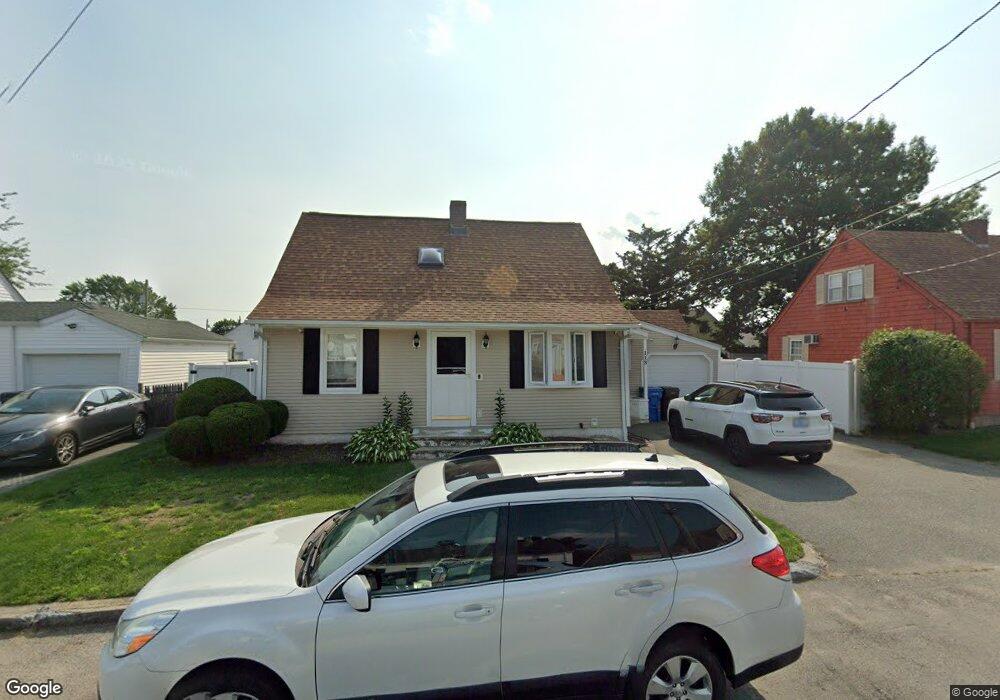
118 Chandler Ave Cranston, RI 02910
Stadium NeighborhoodEstimated Value: $417,518 - $459,000
3
Beds
2
Baths
1,352
Sq Ft
$320/Sq Ft
Est. Value
About This Home
This home is located at 118 Chandler Ave, Cranston, RI 02910 and is currently estimated at $432,130, approximately $319 per square foot. 118 Chandler Ave is a home located in Providence County with nearby schools including Stadium Elementary School, Hugh B. Bain Middle School, and Cranston High School East.
Ownership History
Date
Name
Owned For
Owner Type
Purchase Details
Closed on
May 28, 1993
Sold by
Orleck Ruth A
Bought by
Liberatore Joseph A and Liberatore Bethany
Current Estimated Value
Home Financials for this Owner
Home Financials are based on the most recent Mortgage that was taken out on this home.
Original Mortgage
$79,920
Interest Rate
7.41%
Create a Home Valuation Report for This Property
The Home Valuation Report is an in-depth analysis detailing your home's value as well as a comparison with similar homes in the area
Home Values in the Area
Average Home Value in this Area
Purchase History
| Date | Buyer | Sale Price | Title Company |
|---|---|---|---|
| Liberatore Joseph A | $100,000 | -- |
Source: Public Records
Mortgage History
| Date | Status | Borrower | Loan Amount |
|---|---|---|---|
| Open | Liberatore Joseph A | $95,000 | |
| Closed | Liberatore Joseph A | $87,800 | |
| Closed | Liberatore Joseph A | $79,920 |
Source: Public Records
Tax History Compared to Growth
Tax History
| Year | Tax Paid | Tax Assessment Tax Assessment Total Assessment is a certain percentage of the fair market value that is determined by local assessors to be the total taxable value of land and additions on the property. | Land | Improvement |
|---|---|---|---|---|
| 2025 | $4,660 | $335,700 | $97,100 | $238,600 |
| 2024 | $4,569 | $335,700 | $97,100 | $238,600 |
| 2023 | $4,328 | $229,000 | $67,000 | $162,000 |
| 2022 | $4,239 | $229,000 | $67,000 | $162,000 |
| 2021 | $4,122 | $229,000 | $67,000 | $162,000 |
| 2020 | $3,923 | $188,900 | $63,600 | $125,300 |
| 2019 | $3,923 | $188,900 | $63,600 | $125,300 |
| 2018 | $3,833 | $188,900 | $63,600 | $125,300 |
| 2017 | $3,409 | $148,600 | $46,900 | $101,700 |
| 2016 | $3,336 | $148,600 | $46,900 | $101,700 |
| 2015 | $3,336 | $148,600 | $46,900 | $101,700 |
| 2014 | $3,289 | $144,000 | $46,900 | $97,100 |
Source: Public Records
Map
Nearby Homes
- 124 Chandler Ave
- 112 Chandler Ave
- 105 Westcott Ave
- 109 Westcott Ave
- 101 Westcott Ave
- 113 Westcott Ave
- 106 Chandler Ave
- 113 Chandler Ave
- 119 Chandler Ave
- 132 Chandler Ave
- 117 Westcott Ave
- 109 Chandler Ave
- 125 Chandler Ave
- 93 Westcott Ave
- 103 Chandler Ave
- 121 Westcott Ave
- 96 Chandler Ave
- 131 Chandler Ave
- 99 Chandler Ave
- 106 Westcott Ave