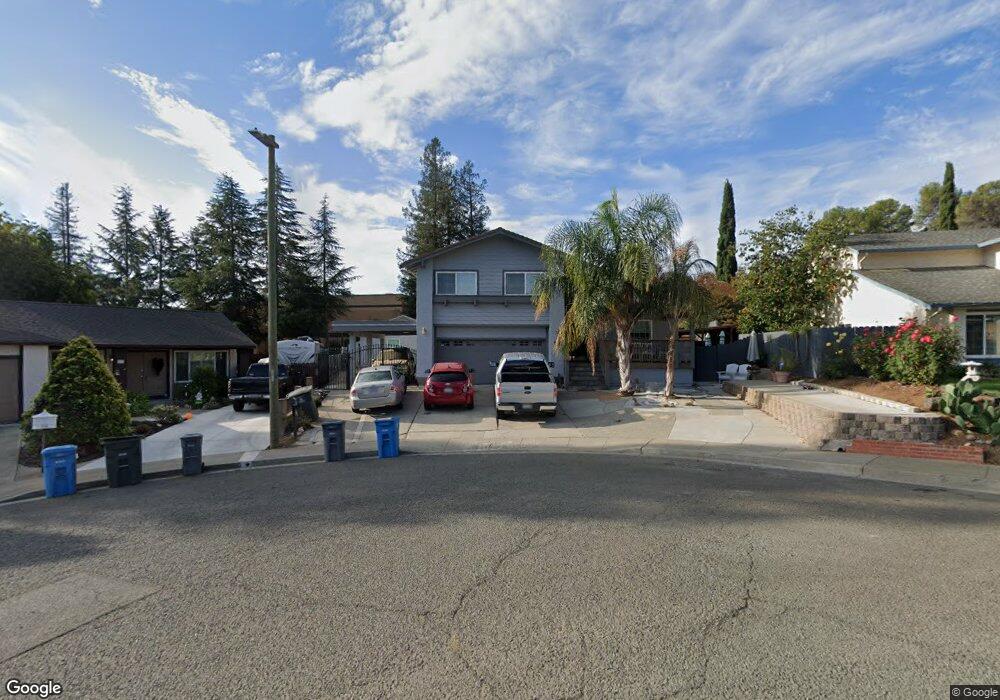
118 Daffodil Cir Vallejo, CA 94591
Estimated Value: $652,000 - $768,000
4
Beds
3
Baths
2,696
Sq Ft
$263/Sq Ft
Est. Value
About This Home
This home is located at 118 Daffodil Cir, Vallejo, CA 94591 and is currently estimated at $708,039, approximately $262 per square foot. 118 Daffodil Cir is a home located in Solano County with nearby schools including Annie Pennycook Elementary School, Jesse M. Bethel High School, and Vallejo Charter School.
Ownership History
Date
Name
Owned For
Owner Type
Purchase Details
Closed on
Mar 7, 2017
Sold by
Jackson Hattie L and Jackson Magee Hattie L
Bought by
Jackson Hattie L
Current Estimated Value
Home Financials for this Owner
Home Financials are based on the most recent Mortgage that was taken out on this home.
Original Mortgage
$315,000
Interest Rate
4.19%
Mortgage Type
New Conventional
Purchase Details
Closed on
May 29, 2007
Sold by
Magee Alan L
Bought by
Jackson Magee Hattie L
Home Financials for this Owner
Home Financials are based on the most recent Mortgage that was taken out on this home.
Original Mortgage
$500,000
Interest Rate
7.12%
Mortgage Type
New Conventional
Purchase Details
Closed on
Dec 30, 2002
Sold by
Magee Alan L
Bought by
Jackson Magee Hattie L
Home Financials for this Owner
Home Financials are based on the most recent Mortgage that was taken out on this home.
Original Mortgage
$171,000
Interest Rate
8.55%
Create a Home Valuation Report for This Property
The Home Valuation Report is an in-depth analysis detailing your home's value as well as a comparison with similar homes in the area
Purchase History
| Date | Buyer | Sale Price | Title Company |
|---|---|---|---|
| Jackson Hattie L | -- | Old Republic Title Co | |
| Jackson Magee Hattie L | -- | Placer Title Company | |
| Jackson Magee Hattie L | -- | Financial Title Company |
Source: Public Records
Mortgage History
| Date | Status | Borrower | Loan Amount |
|---|---|---|---|
| Closed | Jackson Hattie L | $315,000 | |
| Closed | Jackson Magee Hattie L | $500,000 | |
| Closed | Jackson Magee Hattie L | $171,000 |
Source: Public Records
Tax History Compared to Growth
Tax History
| Year | Tax Paid | Tax Assessment Tax Assessment Total Assessment is a certain percentage of the fair market value that is determined by local assessors to be the total taxable value of land and additions on the property. | Land | Improvement |
|---|---|---|---|---|
| 2025 | $6,829 | $422,560 | $73,589 | $348,971 |
| 2024 | $6,829 | $414,276 | $72,147 | $342,129 |
| 2023 | $6,459 | $406,154 | $70,733 | $335,421 |
| 2022 | $6,301 | $398,192 | $69,347 | $328,845 |
| 2021 | $6,161 | $390,386 | $67,988 | $322,398 |
| 2020 | $6,174 | $386,384 | $67,291 | $319,093 |
| 2019 | $5,955 | $375,076 | $65,970 | $309,106 |
| 2018 | $4,858 | $302,644 | $64,677 | $237,967 |
| 2017 | $4,326 | $266,318 | $63,409 | $202,909 |
| 2016 | $4,554 | $261,097 | $62,166 | $198,931 |
| 2015 | $4,408 | $257,176 | $61,233 | $195,943 |
| 2014 | $4,142 | $252,139 | $60,034 | $192,105 |
Source: Public Records
Map
Nearby Homes
- 118 Hydrangea Ct
- 125 Easson Ct
- 1337 Shea Terrace
- 709 Pope Dr
- 112 Aragon Ct
- 150 Yorkshire Ct
- 8601 Rockaway Dr
- 8620 Rockaway Dr
- 8632 Rockaway Dr
- 256 Honeydew Dr
- 8707 Aquamarine Dr
- 1207 1 2 Warren Ave
- 112 Dyer Ct
- 7283 Abbey Dr
- 257 Valley Oak Ln
- 479 Aragon St
- 1161 Benicia Rd Unit 11
- 1161 Benicia Rd Unit 21
- 1161 Benicia Rd Unit SPC 18
- 235 Toledo Ct
- 112 Daffodil Cir
- 124 Daffodil Cir
- 130 Daffodil Cir
- 106 Daffodil Cir
- 111 Poppy Ct
- 115 Daffodil Cir
- 121 Poppy Ct
- 136 Daffodil Cir
- 100 Daffodil Cir
- 101 Daffodil Cir
- 110 Poppy Ct
- 131 Poppy Ct
- 142 Daffodil Cir
- 141 Daffodil Cir
- 801 Greenmont Dr
- 148 Daffodil Cir
- 155 Daffodil Cir
- 120 Poppy Ct
- 620 Greenmont Dr
- 185 Daffodil Cir