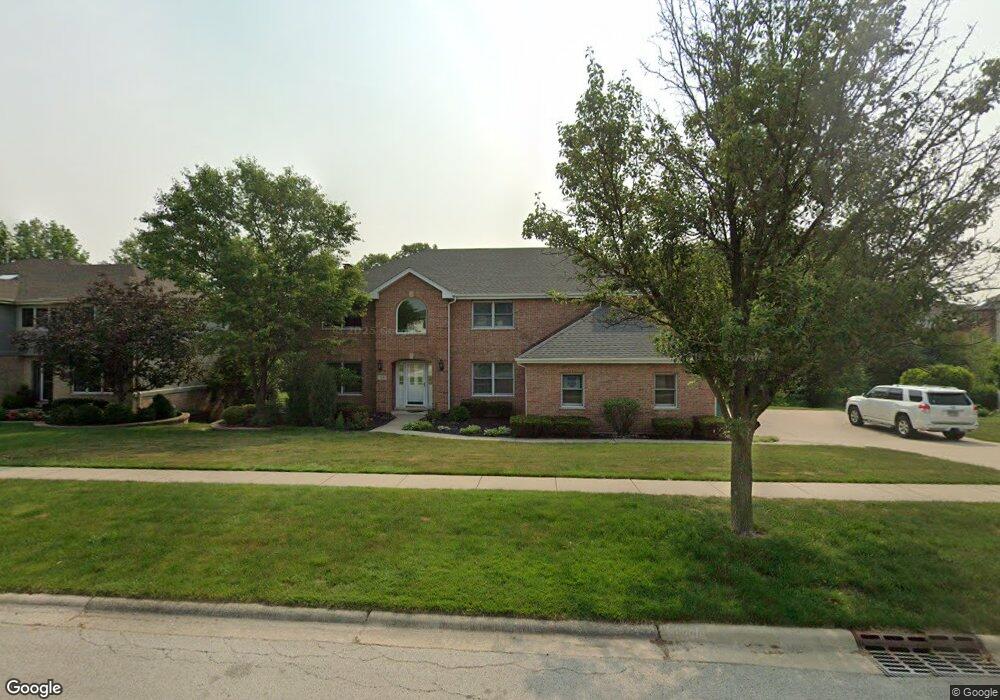
118 Doolin St Lemont, IL 60439
West Lemont NeighborhoodEstimated Value: $682,000 - $803,000
5
Beds
4
Baths
2,843
Sq Ft
$255/Sq Ft
Est. Value
About This Home
This home is located at 118 Doolin St, Lemont, IL 60439 and is currently estimated at $724,862, approximately $254 per square foot. 118 Doolin St is a home located in Cook County with nearby schools including Oakwood School, River Valley School, and Old Quarry Middle School.
Ownership History
Date
Name
Owned For
Owner Type
Purchase Details
Closed on
Apr 18, 2017
Sold by
Lejman Thomas J and Farano Penny M
Bought by
Bolick Martin and Bolick Arlene
Current Estimated Value
Home Financials for this Owner
Home Financials are based on the most recent Mortgage that was taken out on this home.
Original Mortgage
$424,100
Outstanding Balance
$352,915
Interest Rate
4.21%
Mortgage Type
New Conventional
Estimated Equity
$371,947
Purchase Details
Closed on
Sep 4, 1996
Sold by
State Bank Of Countryside
Bought by
Lejman Thomas J and Lejman Penny M
Home Financials for this Owner
Home Financials are based on the most recent Mortgage that was taken out on this home.
Original Mortgage
$230,000
Interest Rate
8.37%
Purchase Details
Closed on
Nov 29, 1995
Sold by
Financial Properties Inc
Bought by
State Bank Of Countryside
Home Financials for this Owner
Home Financials are based on the most recent Mortgage that was taken out on this home.
Original Mortgage
$60,000
Interest Rate
7.52%
Create a Home Valuation Report for This Property
The Home Valuation Report is an in-depth analysis detailing your home's value as well as a comparison with similar homes in the area
Home Values in the Area
Average Home Value in this Area
Purchase History
| Date | Buyer | Sale Price | Title Company |
|---|---|---|---|
| Bolick Martin | -- | Premier Title | |
| Lejman Thomas J | $288,000 | -- | |
| State Bank Of Countryside | $40,000 | -- |
Source: Public Records
Mortgage History
| Date | Status | Borrower | Loan Amount |
|---|---|---|---|
| Open | Bolick Martin | $424,100 | |
| Previous Owner | Lejman Thomas J | $230,000 | |
| Previous Owner | State Bank Of Countryside | $60,000 |
Source: Public Records
Tax History Compared to Growth
Tax History
| Year | Tax Paid | Tax Assessment Tax Assessment Total Assessment is a certain percentage of the fair market value that is determined by local assessors to be the total taxable value of land and additions on the property. | Land | Improvement |
|---|---|---|---|---|
| 2024 | $12,261 | $59,000 | $9,335 | $49,665 |
| 2023 | $10,350 | $59,000 | $9,335 | $49,665 |
| 2022 | $10,350 | $42,633 | $8,258 | $34,375 |
| 2021 | $10,034 | $42,632 | $8,258 | $34,374 |
| 2020 | $10,139 | $42,632 | $8,258 | $34,374 |
| 2019 | $10,795 | $46,671 | $8,258 | $38,413 |
| 2018 | $10,617 | $46,671 | $8,258 | $38,413 |
| 2017 | $9,702 | $46,671 | $8,258 | $38,413 |
| 2016 | $8,984 | $40,552 | $6,821 | $33,731 |
| 2015 | $9,089 | $40,552 | $6,821 | $33,731 |
| 2014 | $9,189 | $40,552 | $6,821 | $33,731 |
| 2013 | $9,713 | $45,360 | $6,821 | $38,539 |
Source: Public Records
Map
Nearby Homes
- Brighton Plan at Copper Ridge Townhomes
- B Saybrook Plan at Copper Ridge Townhomes
- A Saybrook Plan at Copper Ridge Townhomes
- Sienna Plan at Copper Ridge Townhomes
- Breckenridge Plan at Copper Ridge Townhomes
- Sorrento Plan at Copper Ridge Townhomes
- Telluride Plan at Copper Ridge Townhomes
- 1104 Walter St
- 1025 Walter St
- 12 Meagan Ln
- 1023 Walter St
- 1105 Walter St
- 12239 Copper Ridge Dr Unit 19
- 1201 Leinster Dr
- 4 Ridge Rd
- 606 Valley Dr
- 905 State St
- 16451 Kayla Dr
- 12891 Mayfair Dr
- Ravello Plan at Villas at Rolling Meadows