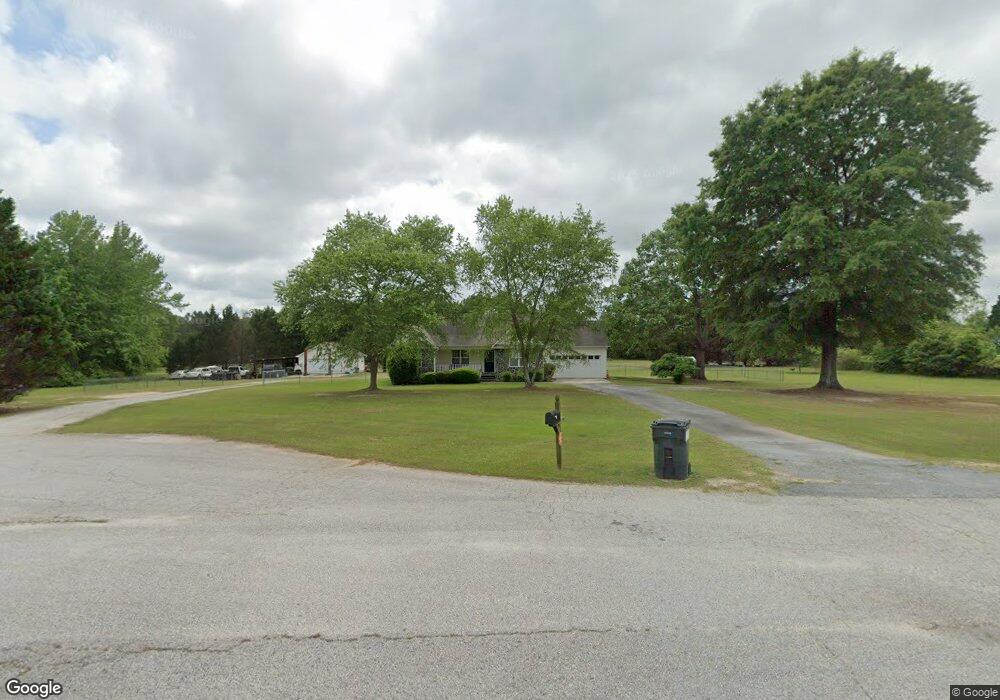
118 Dove Run Williamson, GA 30292
Estimated Value: $274,193 - $349,000
--
Bed
2
Baths
1,326
Sq Ft
$237/Sq Ft
Est. Value
About This Home
This home is located at 118 Dove Run, Williamson, GA 30292 and is currently estimated at $314,298, approximately $237 per square foot. 118 Dove Run is a home located in Pike County with nearby schools including Pike County Primary School, Pike County Elementary School, and Pike County Middle School.
Ownership History
Date
Name
Owned For
Owner Type
Purchase Details
Closed on
Jan 16, 2019
Sold by
Camp Chris J
Bought by
Eskew David Ryan
Current Estimated Value
Home Financials for this Owner
Home Financials are based on the most recent Mortgage that was taken out on this home.
Original Mortgage
$164,957
Outstanding Balance
$147,556
Interest Rate
5.5%
Mortgage Type
FHA
Estimated Equity
$166,742
Purchase Details
Closed on
Dec 1, 2018
Sold by
Camp Chris
Bought by
Camp Chris J
Home Financials for this Owner
Home Financials are based on the most recent Mortgage that was taken out on this home.
Original Mortgage
$164,957
Outstanding Balance
$147,556
Interest Rate
5.5%
Mortgage Type
FHA
Estimated Equity
$166,742
Purchase Details
Closed on
Jun 7, 2000
Sold by
Lawrence Lucius and Lawrence Ricky
Bought by
Camp Chris J and Julie Renee
Purchase Details
Closed on
Oct 5, 1999
Sold by
Double P Development Corporation
Bought by
Lawrence Lucius and Lawrence Ricky
Create a Home Valuation Report for This Property
The Home Valuation Report is an in-depth analysis detailing your home's value as well as a comparison with similar homes in the area
Home Values in the Area
Average Home Value in this Area
Purchase History
| Date | Buyer | Sale Price | Title Company |
|---|---|---|---|
| Eskew David Ryan | $168,000 | -- | |
| Camp Chris J | -- | -- | |
| Camp Chris J | $114,000 | -- | |
| Lawrence Lucius | $20,400 | -- |
Source: Public Records
Mortgage History
| Date | Status | Borrower | Loan Amount |
|---|---|---|---|
| Open | Eskew David Ryan | $164,957 |
Source: Public Records
Tax History Compared to Growth
Tax History
| Year | Tax Paid | Tax Assessment Tax Assessment Total Assessment is a certain percentage of the fair market value that is determined by local assessors to be the total taxable value of land and additions on the property. | Land | Improvement |
|---|---|---|---|---|
| 2024 | $2,352 | $94,883 | $20,496 | $74,387 |
| 2023 | $2,753 | $94,883 | $20,496 | $74,387 |
| 2022 | $1,938 | $66,772 | $16,836 | $49,936 |
| 2021 | $2,005 | $66,772 | $16,836 | $49,936 |
| 2020 | $2,029 | $66,772 | $16,836 | $49,936 |
| 2019 | $1,602 | $48,312 | $10,200 | $38,112 |
| 2018 | $1,604 | $48,312 | $10,200 | $38,112 |
| 2017 | $1,591 | $48,312 | $10,200 | $38,112 |
| 2016 | $1,461 | $47,830 | $10,200 | $37,630 |
| 2015 | $1,390 | $47,830 | $10,200 | $37,630 |
| 2014 | $1,410 | $47,830 | $10,200 | $37,630 |
| 2013 | -- | $47,830 | $10,200 | $37,630 |
Source: Public Records
Map
Nearby Homes
- 47 Deer Run
- 308 Deer Run
- 251 Lake Point Dr
- 1946 Highway 362 W
- 457 NW Wisteria Ln NW Unit 62
- LOT 9 Poplar Dr
- 155 Rocky Way
- 0 Traveler Ln Unit 39
- 376 Rocky Way
- 294 Conner Ln
- 158 Conner Ln
- 5120 Blanton Mill Rd
- 4989 Georgia 362
- 16 Nelson Way
- 971 Traveler Ln Unit 43
- 1003 Traveler Ln Unit 44
- 861 Traveler Ln Unit 40
- 79 Huntington Way
- 469 Ashley Glen Dr
- 708 Traveler Ln
- 93 Quail Run
- 201 Golden Cloud Ct
- 218 Golden Cloud Ct Unit 7
- 218 Golden Cloud Ct
- 121 Dove Run
- 173 Deer Run
- 31 Dove Run
- 39 Quail Run
- 61 Deer Run
- 187 Quail Run
- 2445 Highway 362 W
- 166 Quail Run
- 36 Quail Run
- 209 Quail Run
- 172 Deer Run
- 140 Deer Run
- 2645 Highway 362 W
- 392 Quail Run
- 2627 Highway 362 W
- 230 Deer Run