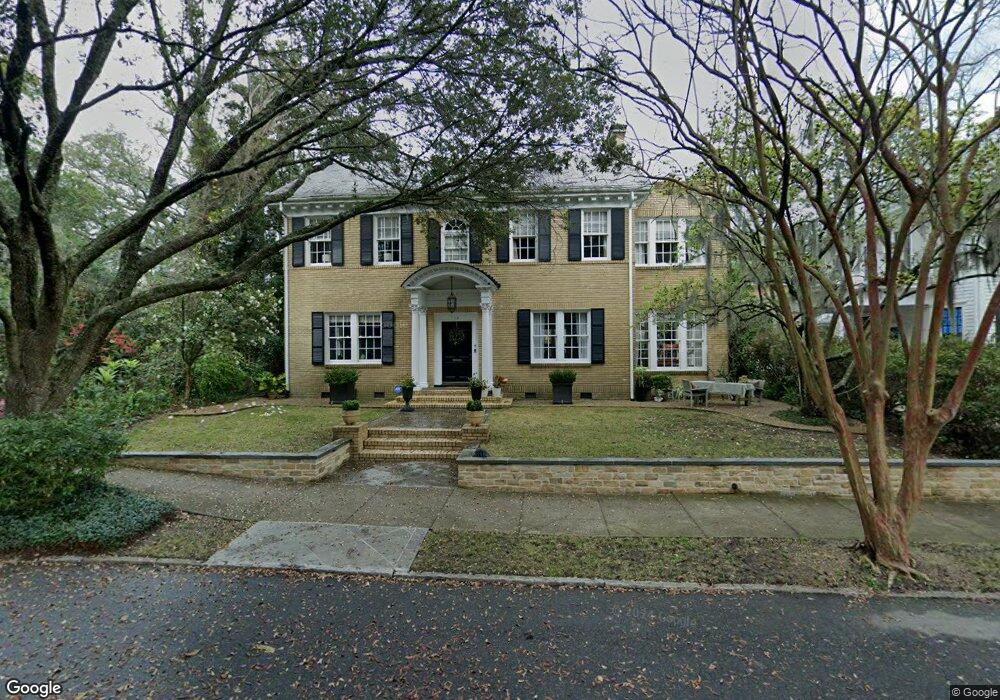
118 E 46th St Savannah, GA 31405
Ardsley Park-Chatham Crescent NeighborhoodEstimated Value: $931,000 - $1,072,000
3
Beds
3
Baths
2,860
Sq Ft
$352/Sq Ft
Est. Value
About This Home
This home is located at 118 E 46th St, Savannah, GA 31405 and is currently estimated at $1,006,359, approximately $351 per square foot. 118 E 46th St is a home located in Chatham County with nearby schools including Jacob G. Smith Elementary School, Myers Middle School, and Beach High School.
Ownership History
Date
Name
Owned For
Owner Type
Purchase Details
Closed on
Apr 30, 2007
Sold by
Not Provided
Bought by
North Elizabeth L
Current Estimated Value
Home Financials for this Owner
Home Financials are based on the most recent Mortgage that was taken out on this home.
Original Mortgage
$512,000
Outstanding Balance
$307,354
Interest Rate
6.11%
Mortgage Type
New Conventional
Estimated Equity
$699,005
Create a Home Valuation Report for This Property
The Home Valuation Report is an in-depth analysis detailing your home's value as well as a comparison with similar homes in the area
Home Values in the Area
Average Home Value in this Area
Purchase History
| Date | Buyer | Sale Price | Title Company |
|---|---|---|---|
| North Elizabeth L | $460,000 | -- | |
| North Elizabeth L | $460,000 | -- |
Source: Public Records
Mortgage History
| Date | Status | Borrower | Loan Amount |
|---|---|---|---|
| Open | North Elizabeth L | $512,000 | |
| Closed | North Elizabeth L | $64,000 | |
| Closed | North Elizabeth L | $512,000 |
Source: Public Records
Tax History Compared to Growth
Tax History
| Year | Tax Paid | Tax Assessment Tax Assessment Total Assessment is a certain percentage of the fair market value that is determined by local assessors to be the total taxable value of land and additions on the property. | Land | Improvement |
|---|---|---|---|---|
| 2025 | $6,569 | $395,680 | $64,000 | $331,680 |
| 2024 | $6,569 | $361,880 | $52,000 | $309,880 |
| 2023 | $2,898 | $306,240 | $64,800 | $241,440 |
| 2022 | $2,930 | $273,120 | $20,000 | $253,120 |
| 2021 | $8,888 | $230,320 | $20,000 | $210,320 |
| 2020 | $9,014 | $231,080 | $20,000 | $211,080 |
| 2019 | $8,883 | $219,400 | $20,000 | $199,400 |
| 2018 | $6,025 | $214,600 | $20,000 | $194,600 |
| 2017 | $5,299 | $197,160 | $21,440 | $175,720 |
| 2016 | $4,978 | $179,320 | $21,440 | $157,880 |
| 2015 | $6,282 | $155,040 | $21,440 | $133,600 |
| 2014 | $8,343 | $155,400 | $0 | $0 |
Source: Public Records
Map
Nearby Homes
- 206 E 46th St
- 123 E 46th St
- 215 E 45th St
- 121 E Victory Dr
- 114 E 48th St
- 210 E 48th St
- 302 E 46th St
- 34 Washington Ave
- 309 E 41st St
- 202 E 49th St
- 501 E 41st St
- 317 E 45th St
- 111 E 49th St
- 324 E 46th St
- 0 E Victory Dr Unit SA342445
- 202 E 51st St
- 327 E 49th St
- 137 E 51st St
- 405 Washington Ave
- 635 E Victory Dr