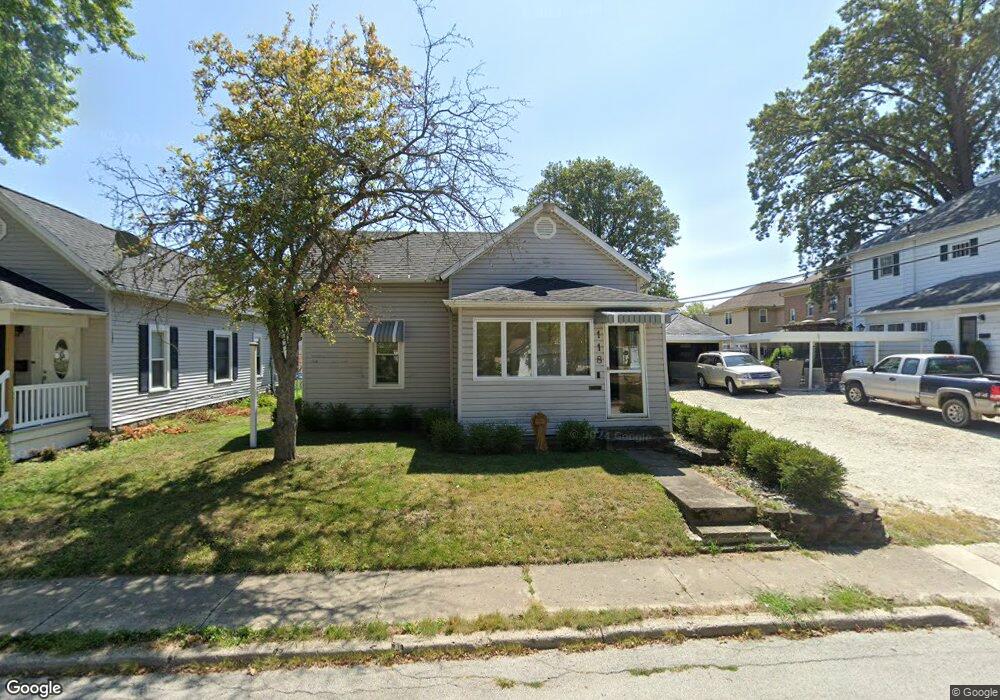
118 E Blake St Celina, OH 45822
Estimated Value: $116,000 - $160,000
1
Bed
1
Bath
1,120
Sq Ft
$126/Sq Ft
Est. Value
About This Home
This home is located at 118 E Blake St, Celina, OH 45822 and is currently estimated at $141,349, approximately $126 per square foot. 118 E Blake St is a home located in Mercer County with nearby schools including Celina Middle School, Celina High School, and Immaculate Conception School.
Ownership History
Date
Name
Owned For
Owner Type
Purchase Details
Closed on
Jun 23, 2025
Sold by
Phlipot Kenneth A and Phlipot Amy L
Bought by
Thobe Maxwell H
Current Estimated Value
Home Financials for this Owner
Home Financials are based on the most recent Mortgage that was taken out on this home.
Original Mortgage
$111,200
Outstanding Balance
$110,912
Interest Rate
6.76%
Mortgage Type
New Conventional
Estimated Equity
$30,437
Purchase Details
Closed on
May 10, 2024
Sold by
Diller Debra A
Bought by
Phlipot Kenneth A and Phlipot Amy L
Purchase Details
Closed on
Aug 7, 2002
Bought by
Shafer Scott A
Create a Home Valuation Report for This Property
The Home Valuation Report is an in-depth analysis detailing your home's value as well as a comparison with similar homes in the area
Home Values in the Area
Average Home Value in this Area
Purchase History
| Date | Buyer | Sale Price | Title Company |
|---|---|---|---|
| Thobe Maxwell H | $162,166 | Four Diamond Title | |
| Phlipot Kenneth A | $116,666 | None Listed On Document | |
| Shafer Scott A | -- | -- |
Source: Public Records
Mortgage History
| Date | Status | Borrower | Loan Amount |
|---|---|---|---|
| Open | Thobe Maxwell H | $111,200 |
Source: Public Records
Tax History
| Year | Tax Paid | Tax Assessment Tax Assessment Total Assessment is a certain percentage of the fair market value that is determined by local assessors to be the total taxable value of land and additions on the property. | Land | Improvement |
|---|---|---|---|---|
| 2025 | $1,628 | $41,270 | $6,370 | $34,900 |
| 2024 | $1,634 | $41,270 | $6,370 | $34,900 |
| 2023 | $1,628 | $41,270 | $6,370 | $34,900 |
| 2022 | $1,587 | $35,110 | $5,250 | $29,860 |
| 2021 | $1,528 | $33,740 | $5,250 | $28,490 |
| 2020 | $1,280 | $33,740 | $5,250 | $28,490 |
| 2019 | $1,056 | $26,120 | $3,750 | $22,370 |
| 2018 | $1,098 | $26,120 | $3,750 | $22,370 |
| 2017 | $1,060 | $26,120 | $3,750 | $22,370 |
| 2016 | $1,021 | $24,580 | $3,750 | $20,830 |
| 2015 | $992 | $24,580 | $3,750 | $20,830 |
| 2014 | $994 | $24,580 | $3,750 | $20,830 |
| 2013 | $1,056 | $24,580 | $3,750 | $20,830 |
Source: Public Records
Map
Nearby Homes
- 120 E Blake St
- 680 N Main St
- 115 Touvelle St
- 206 Magnolia St
- 314 Magnolia St
- 328 E Livingston St
- 316 Dogwood Dr
- 319 E Fayette St
- 906 N Sugar St
- 545 E Anthony St
- 908 N Sugar St
- 1001 N Sugar St
- 630 N Brandon Ave
- 1021 Hemlock St
- 1109 Shimp Dr
- 415 S Sugar St
- 116 S Elm St
- 1018 Lilac St
- 802 E Market St
- 1201 Lilac Dr
Your Personal Tour Guide
Ask me questions while you tour the home.