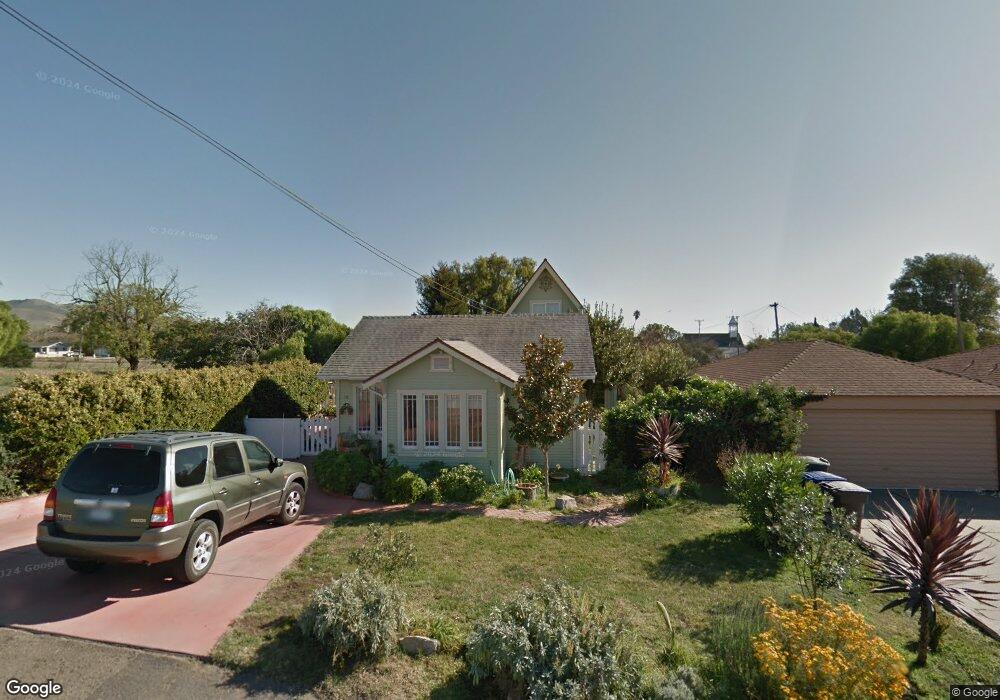
118 E Chestnut St Nipomo, CA 93444
Estimated Value: $431,000 - $553,000
2
Beds
1
Bath
800
Sq Ft
$588/Sq Ft
Est. Value
About This Home
This home is located at 118 E Chestnut St, Nipomo, CA 93444 and is currently estimated at $470,288, approximately $587 per square foot. 118 E Chestnut St is a home located in San Luis Obispo County with nearby schools including Nipomo Elementary School, Mesa Middle School, and Nipomo High School.
Ownership History
Date
Name
Owned For
Owner Type
Purchase Details
Closed on
Mar 25, 2015
Sold by
Barrackman Brad
Bought by
Barrackman Susan
Current Estimated Value
Purchase Details
Closed on
Apr 12, 2001
Sold by
Barrackman Susan
Bought by
Barrackman Brad
Home Financials for this Owner
Home Financials are based on the most recent Mortgage that was taken out on this home.
Original Mortgage
$109,000
Outstanding Balance
$40,062
Interest Rate
6.98%
Estimated Equity
$430,226
Purchase Details
Closed on
Mar 5, 1999
Sold by
Hosier Allen J and Hosier Michelle A
Bought by
Barrackman Brad
Home Financials for this Owner
Home Financials are based on the most recent Mortgage that was taken out on this home.
Original Mortgage
$112,100
Interest Rate
6.7%
Create a Home Valuation Report for This Property
The Home Valuation Report is an in-depth analysis detailing your home's value as well as a comparison with similar homes in the area
Home Values in the Area
Average Home Value in this Area
Purchase History
| Date | Buyer | Sale Price | Title Company |
|---|---|---|---|
| Barrackman Susan | -- | Public | |
| Barrackman Brad | -- | Fidelity National Title Co | |
| Barrackman Brad | $118,500 | Chicago Title Co |
Source: Public Records
Mortgage History
| Date | Status | Borrower | Loan Amount |
|---|---|---|---|
| Open | Barrackman Brad | $109,000 | |
| Closed | Barrackman Brad | $112,100 |
Source: Public Records
Tax History
| Year | Tax Paid | Tax Assessment Tax Assessment Total Assessment is a certain percentage of the fair market value that is determined by local assessors to be the total taxable value of land and additions on the property. | Land | Improvement |
|---|---|---|---|---|
| 2025 | $2,605 | $260,393 | $101,887 | $158,506 |
| 2024 | $2,574 | $255,289 | $99,890 | $155,399 |
| 2023 | $2,574 | $250,284 | $97,932 | $152,352 |
| 2022 | $2,533 | $245,377 | $96,012 | $149,365 |
| 2021 | $2,527 | $240,567 | $94,130 | $146,437 |
| 2020 | $2,498 | $238,101 | $93,165 | $144,936 |
| 2019 | $2,481 | $233,434 | $91,339 | $142,095 |
| 2018 | $2,450 | $228,858 | $89,549 | $139,309 |
| 2017 | $2,402 | $224,372 | $87,794 | $136,578 |
| 2016 | $2,264 | $219,973 | $86,073 | $133,900 |
| 2015 | $2,231 | $216,670 | $84,781 | $131,889 |
| 2014 | $2,147 | $212,427 | $83,121 | $129,306 |
Source: Public Records
Map
Nearby Homes
- 150 E Chestnut St
- 195 E Chestnut St
- 192 E Branch St
- 1 W Branch St
- 189 E Tefft St
- 195 E Tefft St
- 239 E Branch St
- 247 E Branch St
- 285 E Tefft St
- 0 S Burton St
- 267 W Tefft St
- 90111003 W Price St
- 136 Clearwater Ln
- 160 San Antonio Ln
- 449 W Tefft St
- 449 W Tefft St Unit 23
- 449 W Tefft St Unit 22
- 449 W Tefft St Unit 13
- 215 Rancho Rd
- 525 Grande Ave Unit D
- 126 E Chestnut St
- 128 E Chestnut St
- 110 E Chestnut St
- 134 E Chestnut St Unit Ea
- 134 E Chestnut St
- 119 E Branch St
- 115 E Branch St
- 186 N Thompson Ave
- 135 E Chestnut St
- 125 E Branch St
- 145 E Chestnut St
- 125 E Chestnut St
- 155 E Chestnut St
- 115 E Chestnut St
- 166 N Thompson Ave
- 105 E Chestnut St
- 105 E Chestnut Ave
- 184 N Thompson Ave
- 170 N Thompson Ave
- 140 Avocado Ct
Your Personal Tour Guide
Ask me questions while you tour the home.