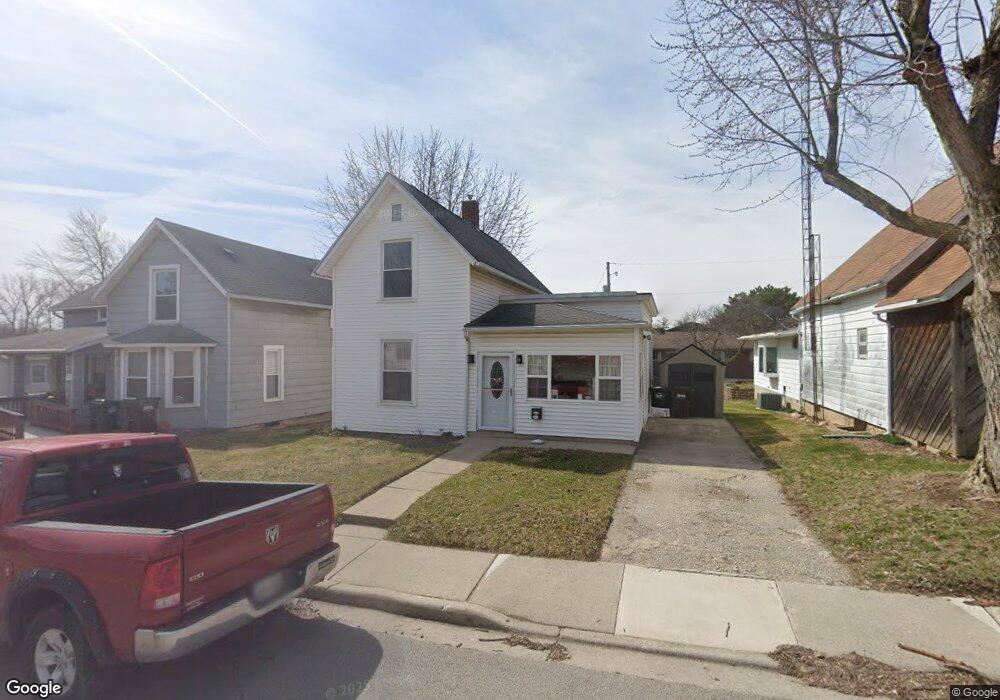
118 E Elm St Bluffton, OH 45817
Estimated Value: $121,000 - $143,000
3
Beds
1
Bath
1,034
Sq Ft
$129/Sq Ft
Est. Value
About This Home
This home is located at 118 E Elm St, Bluffton, OH 45817 and is currently estimated at $133,733, approximately $129 per square foot. 118 E Elm St is a home located in Allen County with nearby schools including Bluffton Elementary School, Bluffton Middle School, and Bluffton High School.
Ownership History
Date
Name
Owned For
Owner Type
Purchase Details
Closed on
Apr 16, 2018
Sold by
Nunley Lisa A and Watson Lisa A
Bought by
Matter Amy Lynn
Current Estimated Value
Purchase Details
Closed on
May 5, 2006
Sold by
Winebrenner Dorothy
Bought by
Nunley Lisa A
Home Financials for this Owner
Home Financials are based on the most recent Mortgage that was taken out on this home.
Original Mortgage
$46,900
Interest Rate
7.87%
Mortgage Type
Adjustable Rate Mortgage/ARM
Purchase Details
Closed on
May 8, 2000
Sold by
Gaiffe Mary F
Bought by
Winebrenner Dorothy
Home Financials for this Owner
Home Financials are based on the most recent Mortgage that was taken out on this home.
Original Mortgage
$40,000
Interest Rate
8.24%
Mortgage Type
New Conventional
Purchase Details
Closed on
Jun 30, 1993
Sold by
Gaiffe William N
Bought by
Gaiffe Mary H Aka
Purchase Details
Closed on
Jan 1, 1990
Bought by
Gaiffe William N
Create a Home Valuation Report for This Property
The Home Valuation Report is an in-depth analysis detailing your home's value as well as a comparison with similar homes in the area
Home Values in the Area
Average Home Value in this Area
Purchase History
| Date | Buyer | Sale Price | Title Company |
|---|---|---|---|
| Matter Amy Lynn | -- | None Available | |
| Nunley Lisa A | $58,900 | None Available | |
| Winebrenner Dorothy | $50,000 | -- | |
| Gaiffe Mary H Aka | -- | -- | |
| Gaiffe William N | -- | -- |
Source: Public Records
Mortgage History
| Date | Status | Borrower | Loan Amount |
|---|---|---|---|
| Previous Owner | Nunley Lisa A | $46,900 | |
| Previous Owner | Winebrenner Dorothy | $40,000 |
Source: Public Records
Tax History Compared to Growth
Tax History
| Year | Tax Paid | Tax Assessment Tax Assessment Total Assessment is a certain percentage of the fair market value that is determined by local assessors to be the total taxable value of land and additions on the property. | Land | Improvement |
|---|---|---|---|---|
| 2024 | $1,197 | $35,320 | $7,530 | $27,790 |
| 2023 | $1,078 | $29,440 | $6,270 | $23,170 |
| 2022 | $1,087 | $29,440 | $6,270 | $23,170 |
| 2021 | $1,094 | $29,440 | $6,270 | $23,170 |
| 2020 | $985 | $23,940 | $6,020 | $17,920 |
| 2019 | $985 | $23,940 | $6,020 | $17,920 |
| 2018 | $990 | $23,940 | $6,020 | $17,920 |
| 2017 | $866 | $20,970 | $6,020 | $14,950 |
| 2016 | $880 | $20,970 | $6,020 | $14,950 |
| 2015 | $815 | $20,970 | $6,020 | $14,950 |
| 2014 | $815 | $18,910 | $5,850 | $13,060 |
| 2013 | $752 | $18,910 | $5,850 | $13,060 |
Source: Public Records
Map
Nearby Homes
- 0 Ohio 103
- 210 N Jackson St
- 222 N Lawn Ave
- 106 Riley St
- 212 S Lawn Ave
- 217 Grove St
- 409 S Main St
- 222 Grove St
- 513 S Jackson St
- 301 Parkview Dr
- 303 Parkview Dr
- 305 Parkview Dr
- 307 Parkview Dr
- 110 Magnolia Ln
- 0 Columbus Grove-Bluffton Rd
- 313 Parkview Dr
- 656 S Main St
- 315 Parkview Dr
- 317 Parkview Dr
- 319 Parkview Dr