Estimated Value: $229,000 - $403,000
Studio
--
Bath
--
Sq Ft
22,346
Sq Ft
About This Home
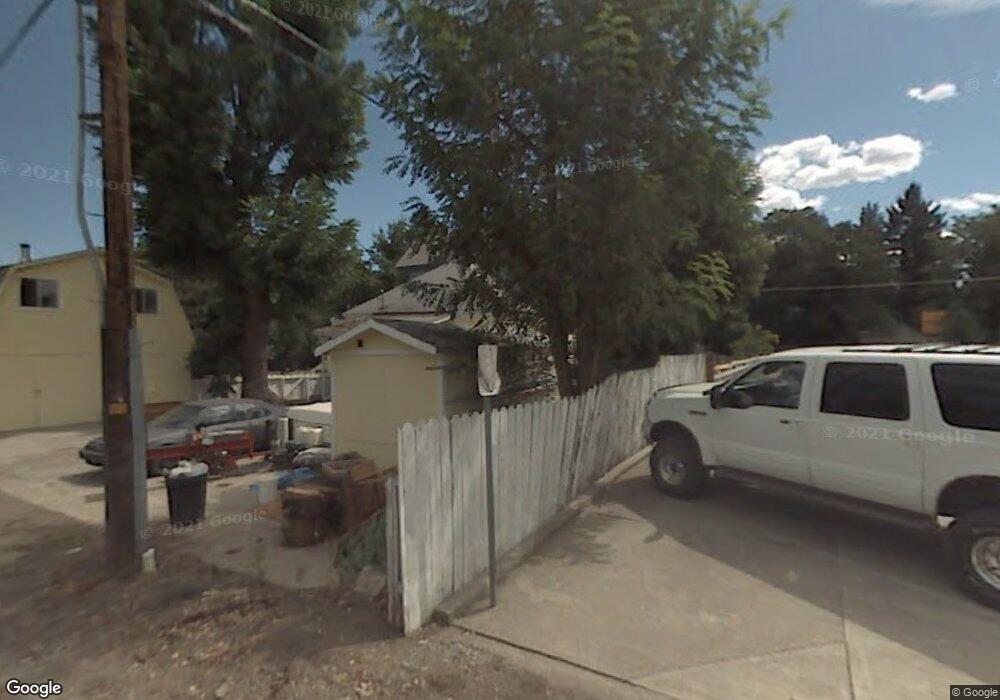
This home is located at 118 E Lennox St, Yreka, CA 96097 and is currently estimated at $300,828. 118 E Lennox St is a home located in Siskiyou County with nearby schools including Evergreen Elementary School, Jackson Street Elementary School, and Yreka High School.
Ownership History
Date
Name
Owned For
Owner Type
Purchase Details
Closed on
Mar 19, 2024
Sold by
Golly James T
Bought by
2024 James T Golly And Rebecca A Hobbs Revoca and Golly
Current Estimated Value
Purchase Details
Closed on
Jan 18, 2007
Sold by
Golly James T
Bought by
Golly James T
Home Financials for this Owner
Home Financials are based on the most recent Mortgage that was taken out on this home.
Original Mortgage
$262,000
Interest Rate
5.75%
Mortgage Type
Stand Alone Refi Refinance Of Original Loan
Purchase Details
Closed on
Mar 31, 2004
Sold by
Golly Patricia
Bought by
Golly James T
Home Financials for this Owner
Home Financials are based on the most recent Mortgage that was taken out on this home.
Original Mortgage
$152,000
Interest Rate
5.56%
Mortgage Type
Purchase Money Mortgage
Create a Home Valuation Report for This Property
The Home Valuation Report is an in-depth analysis detailing your home's value as well as a comparison with similar homes in the area
Home Values in the Area
Average Home Value in this Area
Purchase History
| Date | Buyer | Sale Price | Title Company |
|---|---|---|---|
| 2024 James T Golly And Rebecca A Hobbs Revoca | -- | None Listed On Document | |
| Golly James T | -- | Mt Shasta Title & Escrow Co | |
| Golly James T | -- | Siskiyou County Title Co | |
| Golly James T | $190,000 | Siskiyou County Title Co |
Source: Public Records
Mortgage History
| Date | Status | Borrower | Loan Amount |
|---|---|---|---|
| Previous Owner | Golly James T | $262,000 | |
| Previous Owner | Golly James T | $152,000 | |
| Closed | Golly James T | $28,500 |
Source: Public Records
Tax History
| Year | Tax Paid | Tax Assessment Tax Assessment Total Assessment is a certain percentage of the fair market value that is determined by local assessors to be the total taxable value of land and additions on the property. | Land | Improvement |
|---|---|---|---|---|
| 2025 | $2,695 | $270,116 | $81,030 | $189,086 |
| 2023 | $2,695 | $259,630 | $77,885 | $181,745 |
| 2022 | $2,591 | $254,540 | $76,358 | $178,182 |
| 2021 | $2,546 | $249,550 | $74,861 | $174,689 |
| 2020 | $2,528 | $246,992 | $74,094 | $172,898 |
| 2019 | $2,483 | $242,150 | $72,642 | $169,508 |
| 2018 | $2,433 | $237,403 | $71,218 | $166,185 |
| 2017 | $2,386 | $232,749 | $69,822 | $162,927 |
| 2016 | $2,329 | $228,186 | $68,453 | $159,733 |
| 2015 | $2,293 | $224,759 | $67,425 | $157,334 |
| 2014 | $2,209 | $220,358 | $66,105 | $154,253 |
Source: Public Records
Map
Nearby Homes
- 128 E Lennox St
- 129 Meamber Aly
- 130 E Lennox St
- 124 Dexter St
- 117 E Lennox St
- 121 E Lennox St
- 115 E Lennox St
- 128 Dexter St
- 425 Burgess St
- 134 E Lennox St
- 130 Dexter St
- 422 N Main St
- 520 N Main St
- 517 Burgess St
- 132 Dexter St
- 133 E Lennox St
- 403 Burgess St
- 137 E Lennox St
- 414 N Main St
- 129 Dexter St
Your Personal Tour Guide
Ask me questions while you tour the home.