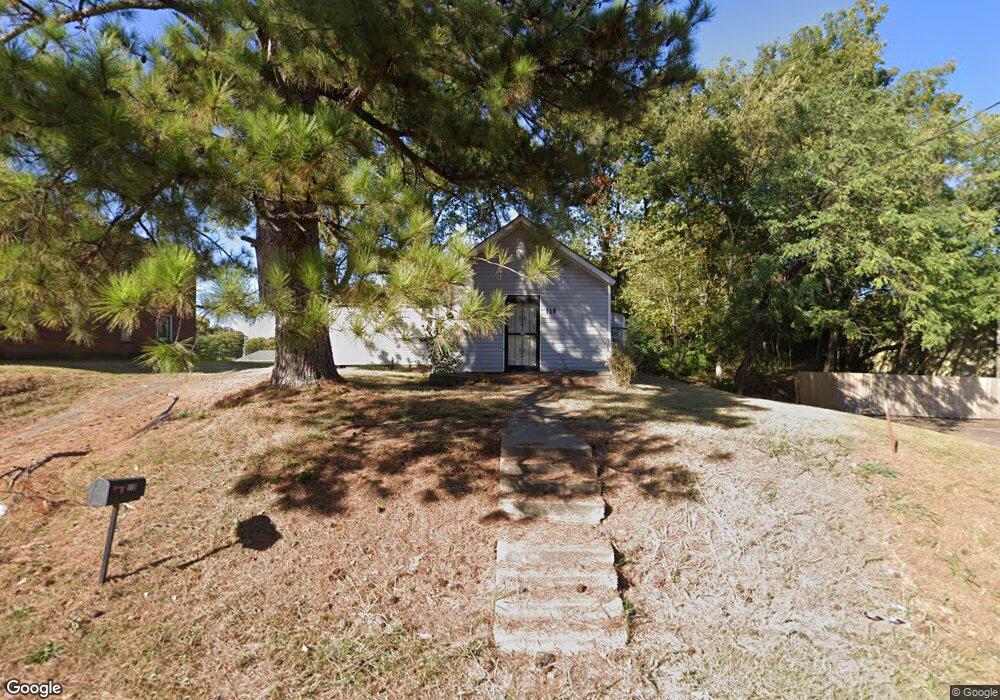
118 E Spring St Covington, TN 38019
Estimated Value: $52,000 - $118,000
Studio
1
Bath
783
Sq Ft
$110/Sq Ft
Est. Value
About This Home
This home is located at 118 E Spring St, Covington, TN 38019 and is currently estimated at $86,437, approximately $110 per square foot. 118 E Spring St is a home located in Tipton County with nearby schools including Crestview Elementary School, Crestview Middle School, and Covington High School.
Ownership History
Date
Name
Owned For
Owner Type
Purchase Details
Closed on
Oct 15, 2018
Sold by
Foster Calvin
Bought by
Canova Tara A
Current Estimated Value
Purchase Details
Closed on
Nov 27, 2006
Sold by
Autrell Williams
Bought by
Calvin Foster
Purchase Details
Closed on
Apr 5, 2006
Sold by
Bond Aubrey L
Bought by
Autrell Williams
Home Financials for this Owner
Home Financials are based on the most recent Mortgage that was taken out on this home.
Original Mortgage
$20,000
Interest Rate
6.29%
Purchase Details
Closed on
Dec 8, 1997
Sold by
Richardson Larry G
Bought by
Bond Aubrey L
Purchase Details
Closed on
May 5, 1997
Sold by
Black Tommy L
Bought by
Richardson Larry G
Purchase Details
Closed on
Jan 1, 1975
Bought by
Wiseman Ernest and Wiseman Peggy
Purchase Details
Closed on
Nov 15, 1949
Create a Home Valuation Report for This Property
The Home Valuation Report is an in-depth analysis detailing your home's value as well as a comparison with similar homes in the area
Purchase History
| Date | Buyer | Sale Price | Title Company |
|---|---|---|---|
| Canova Tara A | $12,500 | -- | |
| Calvin Foster | -- | -- | |
| Autrell Williams | $13,000 | -- | |
| Bond Aubrey L | $12,000 | -- | |
| Richardson Larry G | $4,000 | -- | |
| Wiseman Ernest | $5,000 | -- | |
| -- | -- | -- |
Source: Public Records
Mortgage History
| Date | Status | Borrower | Loan Amount |
|---|---|---|---|
| Previous Owner | Not Available | $20,000 |
Source: Public Records
Tax History
| Year | Tax Paid | Tax Assessment Tax Assessment Total Assessment is a certain percentage of the fair market value that is determined by local assessors to be the total taxable value of land and additions on the property. | Land | Improvement |
|---|---|---|---|---|
| 2025 | -- | $12,600 | $2,760 | $9,840 |
| 2024 | $0 | $12,600 | $2,760 | $9,840 |
| 2023 | $192 | $12,600 | $2,760 | $9,840 |
| 2022 | $315 | $9,600 | $2,760 | $6,840 |
| 2021 | $240 | $9,600 | $2,760 | $6,840 |
| 2020 | $240 | $7,320 | $2,760 | $4,560 |
| 2019 | $239 | $6,360 | $2,760 | $3,600 |
| 2018 | $239 | $6,360 | $2,760 | $3,600 |
| 2017 | $239 | $6,360 | $2,760 | $3,600 |
| 2016 | $239 | $6,360 | $2,760 | $3,600 |
| 2015 | $253 | $6,760 | $2,760 | $4,000 |
| 2014 | $253 | $6,759 | $0 | $0 |
Source: Public Records
Map
Nearby Homes
- 301 N Maple St
- 215 N Maple St
- 319 N Maple St
- 212 Feezor St
- 212 S Tipton St
- 0 N Munford St Unit 10156263
- 0 N Munford St Unit 10156264
- 200 E Washington Ave
- 212 E Washington Ave
- 224 E Washington Ave
- 236 E Washington Ave
- 248 E Washington Ave
- 260 E Washington Ave
- 272 E Washington Ave
- 284 E Washington Ave
- 296 E Washington Ave
- 311 E Ripley Ave
- 111 W Washington Ave
- 320 N High St
- 316 N High St
- 211 N Maple St
- 210 N Main St
- 110 Maley Cir
- 108 Maley Cir
- 111 N Maple St
- 300 N Main St
- 304 N Main St
- 305 N Maple St
- 206 N Maple St
- 210 N Maple St
- 205 N Main St
- 128 E Liberty Ave
- 110 E Liberty Ave
- 130 E Liberty Ave
- 108 E Liberty Ave
- 214 N Maple St
- 134 E Liberty Ave Unit A&B
- 132 E Liberty Ave Unit A &B
- 132 E Liberty Ave
- 106 E Liberty Ave
Your Personal Tour Guide
Ask me questions while you tour the home.