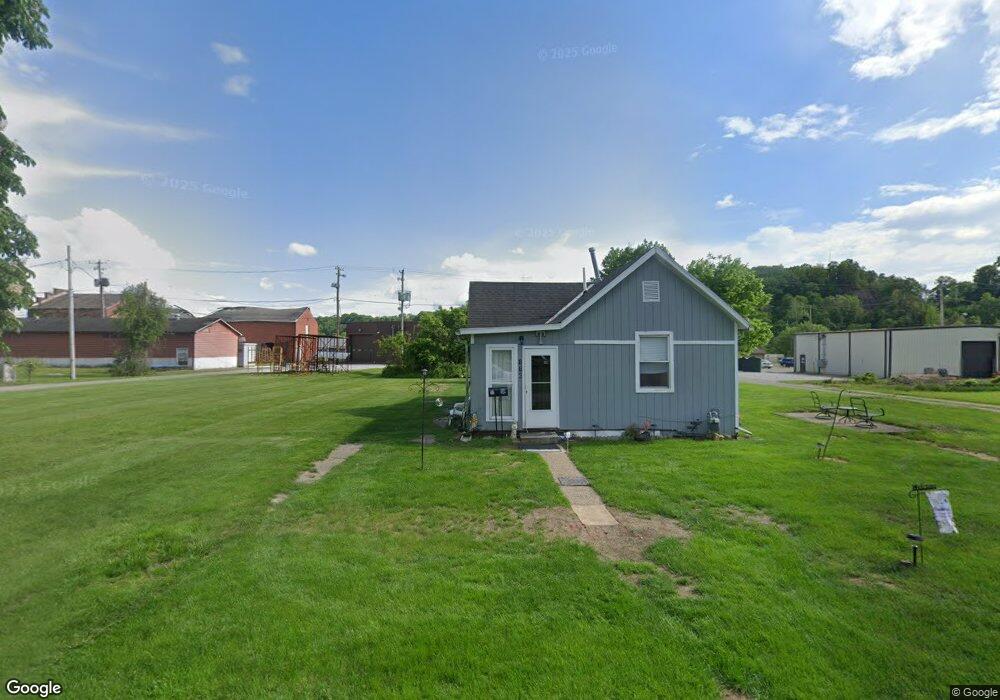
118 Gomber Ave Cambridge, OH 43725
Estimated Value: $66,000 - $120,000
2
Beds
1
Bath
1,190
Sq Ft
$79/Sq Ft
Est. Value
About This Home
This home is located at 118 Gomber Ave, Cambridge, OH 43725 and is currently estimated at $94,000, approximately $78 per square foot. 118 Gomber Ave is a home located in Guernsey County with nearby schools including Cambridge High School, Foxfire East Academy, and St. Benedict Elementary School.
Ownership History
Date
Name
Owned For
Owner Type
Purchase Details
Closed on
Jan 17, 2025
Sold by
Sjy Holdings Llc
Bought by
Quest Capital Llc
Current Estimated Value
Home Financials for this Owner
Home Financials are based on the most recent Mortgage that was taken out on this home.
Original Mortgage
$616,250
Outstanding Balance
$606,124
Interest Rate
6.6%
Mortgage Type
Credit Line Revolving
Estimated Equity
-$512,124
Create a Home Valuation Report for This Property
The Home Valuation Report is an in-depth analysis detailing your home's value as well as a comparison with similar homes in the area
Home Values in the Area
Average Home Value in this Area
Purchase History
| Date | Buyer | Sale Price | Title Company |
|---|---|---|---|
| Quest Capital Llc | $650,000 | Bennett Title | |
| Quest Capital Llc | $650,000 | Bennett Title |
Source: Public Records
Mortgage History
| Date | Status | Borrower | Loan Amount |
|---|---|---|---|
| Open | Quest Capital Llc | $616,250 | |
| Closed | Quest Capital Llc | $616,250 |
Source: Public Records
Tax History Compared to Growth
Tax History
| Year | Tax Paid | Tax Assessment Tax Assessment Total Assessment is a certain percentage of the fair market value that is determined by local assessors to be the total taxable value of land and additions on the property. | Land | Improvement |
|---|---|---|---|---|
| 2024 | $92 | $1,851 | $1,851 | $0 |
| 2023 | $92 | $1,582 | $1,582 | $0 |
| 2022 | $86 | $1,580 | $1,580 | $0 |
| 2021 | $79 | $1,580 | $1,580 | $0 |
| 2020 | $71 | $1,390 | $1,390 | $0 |
| 2019 | $76 | $1,390 | $1,390 | $0 |
| 2018 | $69 | $1,390 | $1,390 | $0 |
| 2017 | $66 | $1,200 | $1,200 | $0 |
| 2016 | $66 | $1,200 | $1,200 | $0 |
| 2015 | $66 | $1,200 | $1,200 | $0 |
| 2014 | $62 | $1,040 | $1,040 | $0 |
| 2013 | $32 | $1,040 | $1,040 | $0 |
Source: Public Records
Map
Nearby Homes