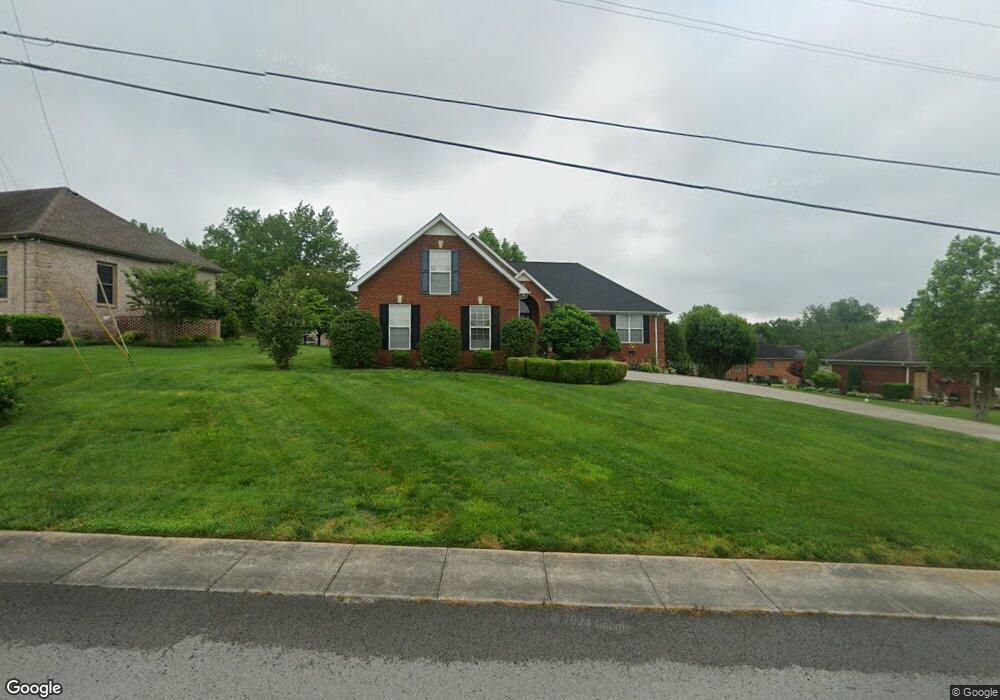
118 Green Hills Dr Shelbyville, TN 37160
Estimated Value: $368,655 - $537,000
--
Bed
3
Baths
2,301
Sq Ft
$193/Sq Ft
Est. Value
About This Home
This home is located at 118 Green Hills Dr, Shelbyville, TN 37160 and is currently estimated at $443,664, approximately $192 per square foot. 118 Green Hills Dr is a home located in Bedford County with nearby schools including East Side Elementary School, Harris Middle School, and Christian Chapel Academy.
Ownership History
Date
Name
Owned For
Owner Type
Purchase Details
Closed on
Jul 7, 2016
Sold by
Cates Bettye S
Bought by
Rogers Carolyn J
Current Estimated Value
Purchase Details
Closed on
Mar 16, 2012
Sold by
Stem Daphne B
Bought by
Stem Bettye S
Home Financials for this Owner
Home Financials are based on the most recent Mortgage that was taken out on this home.
Original Mortgage
$71,556
Interest Rate
3.89%
Purchase Details
Closed on
May 31, 2002
Sold by
Stem James
Bought by
Stem James and Stem Daphne B
Purchase Details
Closed on
Mar 16, 2000
Sold by
Daniel Bill
Bought by
Neese Wayne and Neese Sandra
Purchase Details
Closed on
Jan 5, 2000
Bought by
Neese Wayne Sandra
Purchase Details
Closed on
Jun 16, 1992
Bought by
Daniel Bill
Create a Home Valuation Report for This Property
The Home Valuation Report is an in-depth analysis detailing your home's value as well as a comparison with similar homes in the area
Home Values in the Area
Average Home Value in this Area
Purchase History
| Date | Buyer | Sale Price | Title Company |
|---|---|---|---|
| Rogers Carolyn J | $233,000 | -- | |
| Stem Bettye S | $179,000 | -- | |
| Stem James | -- | -- | |
| Stem Daphne B | $158,000 | -- | |
| Neese Wayne | $14,000 | -- | |
| Neese Wayne Sandra | $14,000 | -- | |
| Daniel Bill | $5,000 | -- |
Source: Public Records
Mortgage History
| Date | Status | Borrower | Loan Amount |
|---|---|---|---|
| Previous Owner | Stem Bettye S | $71,556 |
Source: Public Records
Tax History Compared to Growth
Tax History
| Year | Tax Paid | Tax Assessment Tax Assessment Total Assessment is a certain percentage of the fair market value that is determined by local assessors to be the total taxable value of land and additions on the property. | Land | Improvement |
|---|---|---|---|---|
| 2025 | -- | $66,925 | $0 | $0 |
| 2024 | -- | $66,925 | $9,450 | $57,475 |
| 2023 | $990 | $66,925 | $9,450 | $57,475 |
| 2022 | $2,620 | $66,925 | $9,450 | $57,475 |
| 2021 | $2,379 | $66,925 | $9,450 | $57,475 |
| 2020 | $2,203 | $66,925 | $9,450 | $57,475 |
| 2019 | $2,203 | $49,725 | $6,750 | $42,975 |
| 2018 | $2,153 | $49,725 | $6,750 | $42,975 |
| 2017 | $2,153 | $49,725 | $6,750 | $42,975 |
| 2016 | $2,133 | $49,725 | $6,750 | $42,975 |
| 2015 | $2,133 | $49,725 | $6,750 | $42,975 |
| 2014 | $1,523 | $38,856 | $0 | $0 |
Source: Public Records
Map
Nearby Homes
- 402 Rose Ln
- 1030 Union St
- 223 Megan Cir
- 407 Dow Dr
- 130 Horseshoe Dr
- 103 Laurelwood Dr
- 122 Laurelwood Dr
- 152 Demonbreum Cir
- 410 Dover St
- 329 Dover St
- 106 Demonbreum Cir
- 110 Demonbreum Cir
- 107 Demonbreum Cir
- 111 Demonbreum Cir
- 112 Demombreum Cir
- 100 Demombreum Cir
- 607 Apple Blossom Trail
- 109 Demombreum Cir
- 1615 Elevation ABC Plan at Wheatfield
- 1567 Elevation ABC Plan at Wheatfield