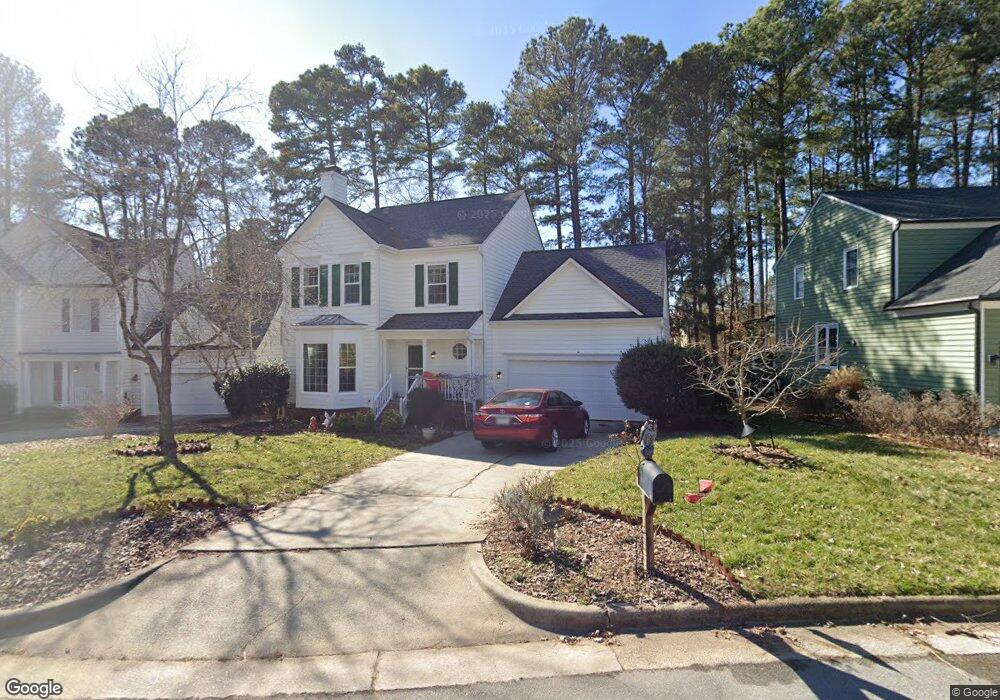
118 Haddonfield Ln Cary, NC 27513
West Cary NeighborhoodEstimated Value: $534,566 - $591,000
4
Beds
3
Baths
2,080
Sq Ft
$271/Sq Ft
Est. Value
About This Home
This home is located at 118 Haddonfield Ln, Cary, NC 27513 and is currently estimated at $564,142, approximately $271 per square foot. 118 Haddonfield Ln is a home located in Wake County with nearby schools including Laurel Park Elementary, Salem Middle, and Green Hope High.
Ownership History
Date
Name
Owned For
Owner Type
Purchase Details
Closed on
Dec 13, 2013
Sold by
Zhu Harold Zhaohui and Han Lan
Bought by
Peipert Robert J and Peipert Ruth E
Current Estimated Value
Home Financials for this Owner
Home Financials are based on the most recent Mortgage that was taken out on this home.
Original Mortgage
$24,500
Outstanding Balance
$18,254
Interest Rate
4.13%
Mortgage Type
Credit Line Revolving
Estimated Equity
$545,888
Purchase Details
Closed on
Jan 29, 2007
Sold by
Porter Jack A F and Lee Hyunok
Bought by
Zhu Harold Zhaohui and Han Lan
Home Financials for this Owner
Home Financials are based on the most recent Mortgage that was taken out on this home.
Original Mortgage
$180,000
Interest Rate
6.07%
Mortgage Type
Purchase Money Mortgage
Purchase Details
Closed on
Jun 27, 2001
Sold by
Hicks Jeffrey T and Hicks Janna R
Bought by
Porter Jack A F
Home Financials for this Owner
Home Financials are based on the most recent Mortgage that was taken out on this home.
Original Mortgage
$131,000
Interest Rate
7.14%
Create a Home Valuation Report for This Property
The Home Valuation Report is an in-depth analysis detailing your home's value as well as a comparison with similar homes in the area
Home Values in the Area
Average Home Value in this Area
Purchase History
| Date | Buyer | Sale Price | Title Company |
|---|---|---|---|
| Peipert Robert J | $248,000 | None Available | |
| Zhu Harold Zhaohui | $225,000 | None Available | |
| Porter Jack A F | $181,000 | -- |
Source: Public Records
Mortgage History
| Date | Status | Borrower | Loan Amount |
|---|---|---|---|
| Open | Peipert Robert J | $24,500 | |
| Open | Peipert Robert J | $198,400 | |
| Previous Owner | Zhu Harold Zhaohui | $180,000 | |
| Previous Owner | Porter Jack A F | $131,000 |
Source: Public Records
Tax History
| Year | Tax Paid | Tax Assessment Tax Assessment Total Assessment is a certain percentage of the fair market value that is determined by local assessors to be the total taxable value of land and additions on the property. | Land | Improvement |
|---|---|---|---|---|
| 2025 | $4,374 | $507,985 | $165,000 | $342,985 |
| 2024 | $4,279 | $507,985 | $165,000 | $342,985 |
Source: Public Records
Map
Nearby Homes
- 208 Trailview Dr
- 215 Trailview Dr
- 104 Foxcrest Ct
- 113 Fetzer Ct
- 101 Paladin Place
- 508 Heathridge Ln
- 502 Heathridge Ln
- 128 Wheatsbury Dr
- 206 Swiss Lake Dr
- 103 Whittlewood Dr
- 112 Hidden Rock Ct
- 110 Mereworth Place
- 101 Cherry Grove Dr
- 614 Gravel Brook Ct
- 111 Gingergate Dr
- 316 Trafalgar Ln
- 266 Joshua Glen Ln
- 146 Swan Quarter Dr
- 111 N Coslett Ct
- 306 Burgwin Wright Way
- 116 Haddonfield Ln
- 120 Haddonfield Ln
- 114 Haddonfield Ln
- 204 Trailview Dr
- 202 Trailview Dr
- 122 Haddonfield Ln
- 206 Trailview Dr
- 119 Haddonfield Ln
- 121 Haddonfield Ln
- 117 Haddonfield Ln
- 112 Haddonfield Ln
- 124 Haddonfield Ln
- 123 Haddonfield Ln
- 103 Glensford Way
- 200 Trailview Dr
- 115 Haddonfield Ln
- 210 Trailview Dr
- 110 Haddonfield Ln
- 206 Ashley Brook Ct
- 114 Ashley Brook Ct
Your Personal Tour Guide
Ask me questions while you tour the home.