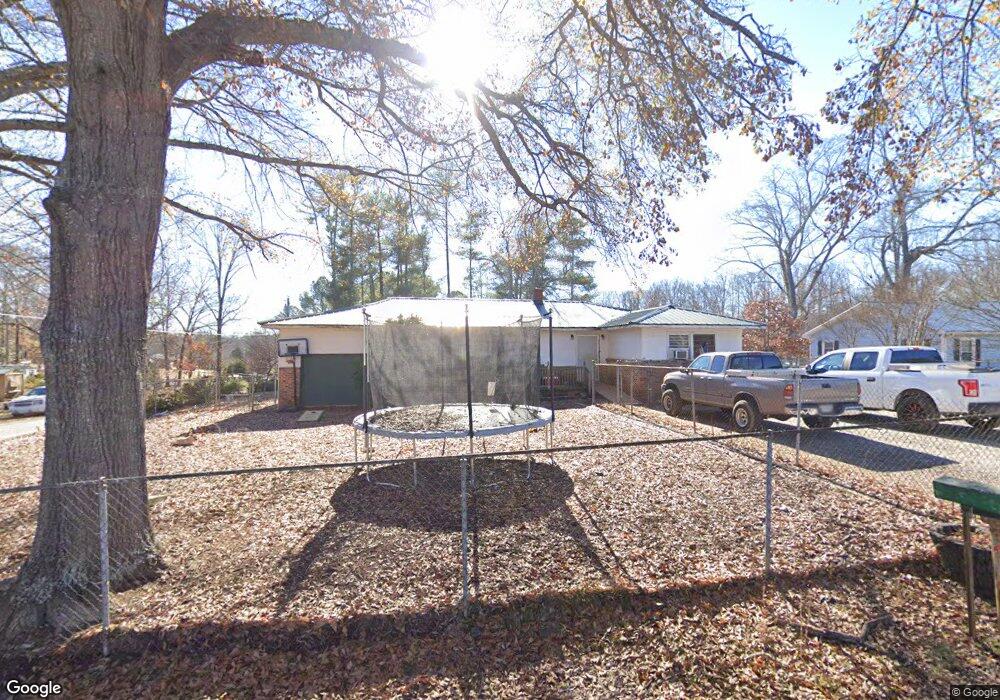
118 Kirby St Unit 122 Landrum, SC 29356
Estimated Value: $143,000 - $394,000
3
Beds
1
Bath
1,455
Sq Ft
$167/Sq Ft
Est. Value
About This Home
This home is located at 118 Kirby St Unit 122, Landrum, SC 29356 and is currently estimated at $243,612, approximately $167 per square foot. 118 Kirby St Unit 122 is a home located in Spartanburg County with nearby schools including O.P. Earle Elementary School, Landrum Middle School, and Landrum High School.
Ownership History
Date
Name
Owned For
Owner Type
Purchase Details
Closed on
Mar 12, 2025
Sold by
Harris Chesley Wayne
Bought by
Heasley Douglas
Current Estimated Value
Home Financials for this Owner
Home Financials are based on the most recent Mortgage that was taken out on this home.
Original Mortgage
$233,500
Interest Rate
6.95%
Mortgage Type
Construction
Purchase Details
Closed on
Jul 13, 2017
Sold by
Capps Brothers Contracting Inc
Bought by
Harris Chesley Wayne
Home Financials for this Owner
Home Financials are based on the most recent Mortgage that was taken out on this home.
Original Mortgage
$53,944
Interest Rate
3.89%
Mortgage Type
Purchase Money Mortgage
Purchase Details
Closed on
Jul 31, 2015
Sold by
Jackson Rita G and Jackson Nelson L
Bought by
Capps Brothers Contracting Inc
Create a Home Valuation Report for This Property
The Home Valuation Report is an in-depth analysis detailing your home's value as well as a comparison with similar homes in the area
Home Values in the Area
Average Home Value in this Area
Purchase History
| Date | Buyer | Sale Price | Title Company |
|---|---|---|---|
| Heasley Douglas | $138,500 | None Listed On Document | |
| Heasley Douglas | $138,500 | None Listed On Document | |
| Harris Chesley Wayne | $52,355 | None Available | |
| Harris Chesley Wayne | $52,355 | None Available | |
| Capps Brothers Contracting Inc | $40,000 | None Available | |
| Capps Brothers Contracting Inc | $40,000 | None Available |
Source: Public Records
Mortgage History
| Date | Status | Borrower | Loan Amount |
|---|---|---|---|
| Closed | Heasley Douglas | $233,500 | |
| Previous Owner | Harris Chesley Wayne | $53,944 |
Source: Public Records
Tax History Compared to Growth
Tax History
| Year | Tax Paid | Tax Assessment Tax Assessment Total Assessment is a certain percentage of the fair market value that is determined by local assessors to be the total taxable value of land and additions on the property. | Land | Improvement |
|---|---|---|---|---|
| 2025 | $1,104 | $3,813 | $918 | $2,895 |
| 2024 | $1,104 | $3,813 | $918 | $2,895 |
| 2023 | $1,104 | $3,813 | $918 | $2,895 |
| 2022 | $978 | $3,316 | $440 | $2,876 |
| 2021 | $978 | $3,316 | $440 | $2,876 |
| 2020 | $960 | $3,316 | $440 | $2,876 |
| 2019 | $960 | $3,316 | $440 | $2,876 |
| 2018 | $960 | $3,316 | $440 | $2,876 |
| 2017 | $760 | $2,520 | $440 | $2,080 |
| 2016 | $2,276 | $4,350 | $1,200 | $3,150 |
| 2015 | $790 | $2,672 | $733 | $1,939 |
| 2014 | $662 | $2,672 | $733 | $1,939 |
Source: Public Records
Map
Nearby Homes
- 118 Kirby St
- 108 Lakeview Dr
- 1504 E Rutherford St
- 1517 E Rutherford St
- 1517 & 1519 E Rutherford St
- 102 W Bridges St
- 174 Page Creek Blvd
- 166 Page Creek Blvd
- 107 S Poplar Ave
- 186 Page Creek Blvd
- 509 S Bomar Ave
- 336 Talbert Trail
- 380 Earles Fort Rd
- 00 N Lee Ave
- 332 Talbert Trail
- 311 E Rutherford St
- 604 Landseer Dr
- 412 N Oak Ave
- 588 Landseer Dr
- 315 Earles Fort Rd
- 200 Kirby St
- 116 Kirby St
- 102 Rickert Ave
- 119 Kirby St
- 201 Kirby St
- 202 Kirby St
- 103 Rickert Ave
- 104 Rickert Ave
- 203 Kirby St
- 109 Lakeview Dr
- 204 Kirby St
- 115 Lakeview Dr
- 205 Kirby St
- 107 Rickert Ave
- 202 Boyce St
- 1514 E Rutherford St
- 1518 E Rutherford St
- 117 Lakeview Dr
- 108 Rickert Ave
- 1518 Highway 14 E