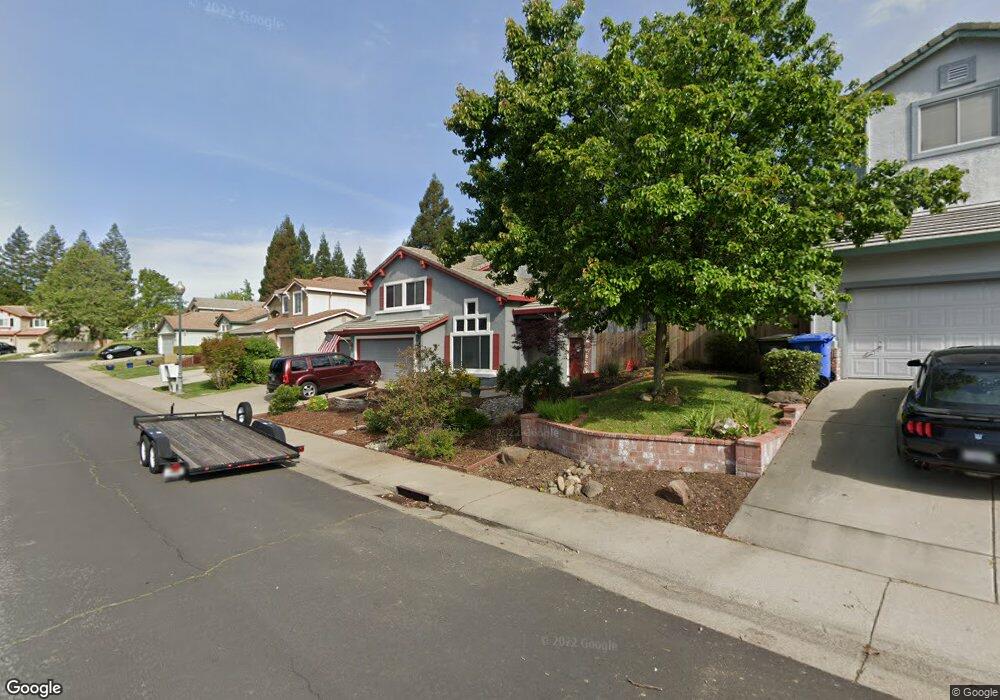
118 Loughridge Way Folsom, CA 95630
Briggs Ranch NeighborhoodEstimated Value: $854,261 - $913,000
4
Beds
3
Baths
2,419
Sq Ft
$363/Sq Ft
Est. Value
About This Home
This home is located at 118 Loughridge Way, Folsom, CA 95630 and is currently estimated at $877,815, approximately $362 per square foot. 118 Loughridge Way is a home located in Sacramento County with nearby schools including Folsom Hills Elementary School, Folsom Middle School, and Vista Del Lago High School.
Ownership History
Date
Name
Owned For
Owner Type
Purchase Details
Closed on
Jul 18, 2024
Sold by
Ryman Laura
Bought by
Laura Ryman Trust and Ryman
Current Estimated Value
Purchase Details
Closed on
Mar 23, 2017
Sold by
Ryman Dennis and Ryman Laura
Bought by
Ryman Laura
Purchase Details
Closed on
Apr 19, 2005
Sold by
Boswell Donald R and Boswell Jean M
Bought by
Ryman Dennis and Ryman Laura
Home Financials for this Owner
Home Financials are based on the most recent Mortgage that was taken out on this home.
Original Mortgage
$359,650
Interest Rate
5.37%
Mortgage Type
Purchase Money Mortgage
Purchase Details
Closed on
Mar 23, 1994
Sold by
Winncrest Homes Inc
Bought by
Boswell Donald R and Boswell Jean M
Home Financials for this Owner
Home Financials are based on the most recent Mortgage that was taken out on this home.
Original Mortgage
$179,313
Interest Rate
7.21%
Mortgage Type
Assumption
Create a Home Valuation Report for This Property
The Home Valuation Report is an in-depth analysis detailing your home's value as well as a comparison with similar homes in the area
Home Values in the Area
Average Home Value in this Area
Purchase History
| Date | Buyer | Sale Price | Title Company |
|---|---|---|---|
| Laura Ryman Trust | -- | None Listed On Document | |
| Ryman Laura | -- | None Available | |
| Ryman Dennis | $545,000 | Financial Title Company | |
| Boswell Donald R | $215,000 | First American Title Ins Co |
Source: Public Records
Mortgage History
| Date | Status | Borrower | Loan Amount |
|---|---|---|---|
| Previous Owner | Ryman Dennis | $359,650 | |
| Previous Owner | Boswell Donald R | $179,313 | |
| Closed | Ryman Dennis | $23,350 |
Source: Public Records
Tax History Compared to Growth
Tax History
| Year | Tax Paid | Tax Assessment Tax Assessment Total Assessment is a certain percentage of the fair market value that is determined by local assessors to be the total taxable value of land and additions on the property. | Land | Improvement |
|---|---|---|---|---|
| 2025 | $8,161 | $759,666 | $209,078 | $550,588 |
| 2024 | $8,161 | $744,772 | $204,979 | $539,793 |
| 2023 | $8,017 | $730,169 | $200,960 | $529,209 |
| 2022 | $7,901 | $715,853 | $197,020 | $518,833 |
| 2021 | $7,796 | $701,817 | $193,157 | $508,660 |
| 2020 | $6,839 | $616,501 | $169,675 | $446,826 |
| 2019 | $6,629 | $595,654 | $163,938 | $431,716 |
| 2018 | $6,283 | $567,291 | $156,132 | $411,159 |
| 2017 | $5,594 | $530,179 | $145,918 | $384,261 |
| 2016 | $5,568 | $495,495 | $136,372 | $359,123 |
| 2015 | $5,257 | $476,438 | $131,127 | $345,311 |
| 2014 | $4,994 | $467,096 | $128,556 | $338,540 |
Source: Public Records
Map
Nearby Homes
- 148 Big Valley Rd
- 164 Rebecca Way
- 242 Briggs Ranch Dr
- 124 Windstar Cir
- 106 Rhoades Way
- 801 Cristina Ct
- 148 Oak Mill Rd
- 128 Mesquite Ct
- 1437 Cummings Way
- 1173 Boxelder Cir
- 1118 Buckbrush Dr
- 1522 Thurman Way
- 1113 Kingfisher Cir
- 1553 Bonanza Ln
- 1480 Bicker Cir
- 1579 Bonanza Ln
- 1752 Parkway Dr N
- 109 Johnston Ct
- 1604 Thurman Way
- 1557 Borrasca Dr
- 116 Loughridge Way
- 120 Loughridge Way
- 172 Briggs Ranch Dr
- 114 Loughridge Way
- 170 Briggs Ranch Dr
- 122 Loughridge Way
- 174 Briggs Ranch Dr
- 106 Estabrook Ln
- 168 Briggs Ranch Dr
- 107 Estabrook Ln
- 107 Loughridge Way
- 112 Loughridge Way
- 176 Briggs Ranch Dr
- 124 Loughridge Way
- 104 Estabrook Ln
- 104 Estabrook Way
- 105 Estabrook Ln
- 105 Loughridge Way
- 166 Briggs Ranch Dr
- 178 Briggs Ranch Dr