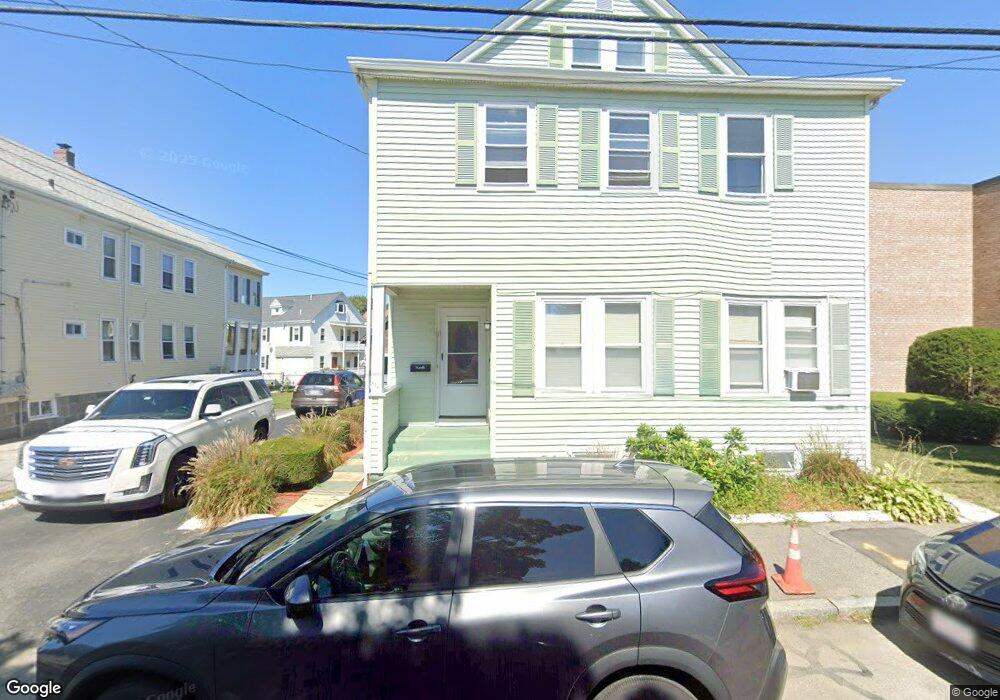
118 Main St Quincy, MA 02169
Quincy Point NeighborhoodEstimated Value: $787,000 - $1,076,000
4
Beds
3
Baths
2,552
Sq Ft
$372/Sq Ft
Est. Value
About This Home
This home is located at 118 Main St, Quincy, MA 02169 and is currently estimated at $949,005, approximately $371 per square foot. 118 Main St is a home located in Norfolk County with nearby schools including Point Webster Middle School, Clifford H. Marshall Elementary School, and Quincy High School.
Ownership History
Date
Name
Owned For
Owner Type
Purchase Details
Closed on
May 3, 2005
Sold by
Priscella Betty L
Bought by
Priscella Ft
Current Estimated Value
Purchase Details
Closed on
Sep 17, 1992
Sold by
Colex Rt
Bought by
Medway Block Co Inc
Home Financials for this Owner
Home Financials are based on the most recent Mortgage that was taken out on this home.
Original Mortgage
$625,000
Interest Rate
8.04%
Mortgage Type
Purchase Money Mortgage
Create a Home Valuation Report for This Property
The Home Valuation Report is an in-depth analysis detailing your home's value as well as a comparison with similar homes in the area
Home Values in the Area
Average Home Value in this Area
Purchase History
| Date | Buyer | Sale Price | Title Company |
|---|---|---|---|
| Priscella Ft | -- | -- | |
| Medway Block Co Inc | $625,000 | -- |
Source: Public Records
Mortgage History
| Date | Status | Borrower | Loan Amount |
|---|---|---|---|
| Previous Owner | Medway Block Co Inc | $40,000 | |
| Previous Owner | Medway Block Co Inc | $625,000 |
Source: Public Records
Tax History Compared to Growth
Tax History
| Year | Tax Paid | Tax Assessment Tax Assessment Total Assessment is a certain percentage of the fair market value that is determined by local assessors to be the total taxable value of land and additions on the property. | Land | Improvement |
|---|---|---|---|---|
| 2025 | $10,662 | $924,700 | $311,400 | $613,300 |
| 2024 | $10,046 | $891,400 | $296,700 | $594,700 |
| 2023 | $9,417 | $846,100 | $270,000 | $576,100 |
| 2022 | $9,572 | $799,000 | $245,800 | $553,200 |
| 2021 | $9,748 | $803,000 | $245,800 | $557,200 |
| 2020 | $9,356 | $752,700 | $232,000 | $520,700 |
| 2019 | $8,864 | $706,300 | $215,000 | $491,300 |
| 2018 | $8,231 | $617,000 | $195,800 | $421,200 |
| 2017 | $8,292 | $585,200 | $186,600 | $398,600 |
| 2016 | $7,301 | $508,400 | $169,900 | $338,500 |
| 2015 | $7,028 | $481,400 | $160,400 | $321,000 |
| 2014 | $6,130 | $412,500 | $160,400 | $252,100 |
Source: Public Records
Map
Nearby Homes
- 51 Sumner St
- 32 Sumner St
- 313 Washington St
- 16 Dartmouth St Unit 16
- 19 Keyes St
- 161 Sumner St Unit 2
- 161 Sumner St Unit 4
- 25 5th Ave
- 16 Perley Place
- 187 Washington St
- 934 Southern Artery Unit 109
- 35 Miller Stile Rd
- 33 Elm St
- 66 Mcgrath Hwy Unit 407
- 66 Mcgrath Hwy Unit 405
- 66 Mcgrath Hwy Unit 308
- 66 Mcgrath Hwy Unit 303
- 66 Mcgrath Hwy Unit 508
- 106 Washington St Unit 45
- 41 Broadway
- 124 Main St Unit 5
- 124 Main St
- 110 Main St
- 17 Grafton St Unit 2
- 126 Main St Unit 3
- 126 Main St Unit 5
- 126 Main St Unit 1
- 126 Main St Unit 6
- 126 Main St
- 126 Main St Unit 2
- 126 Main St Unit 4
- 72 Sumner St
- 66 Sumner St Unit 7
- 62 Sumner St
- 129 Main St Unit 3
- 131 Main St Unit 4
- 121 Main St Unit 8
- 131 Main St Unit 131
- 129 Main St Unit 6
- 131 Main St Unit 6