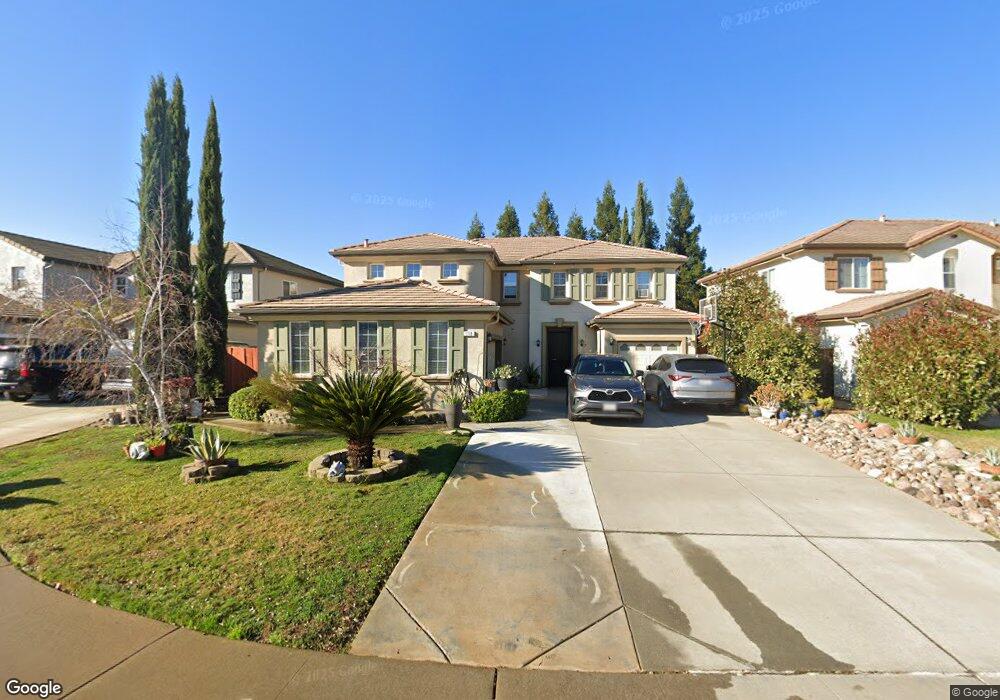
118 Marland Ct Lincoln, CA 95648
Estimated Value: $514,000 - $698,000
4
Beds
2
Baths
2,943
Sq Ft
$218/Sq Ft
Est. Value
About This Home
This home is located at 118 Marland Ct, Lincoln, CA 95648 and is currently estimated at $642,251, approximately $218 per square foot. 118 Marland Ct is a home located in Placer County with nearby schools including Lincoln Crossing Elementary and Twelve Bridges Middle School.
Ownership History
Date
Name
Owned For
Owner Type
Purchase Details
Closed on
Jul 16, 2022
Sold by
Arevalo Jr Emilio M and Arevalo Lorenza C
Bought by
Arevalo Living Trust
Current Estimated Value
Purchase Details
Closed on
Feb 23, 2011
Sold by
Olifir Pavlo S and Olifir Irina
Bought by
Arevalo Emilio M and Arevalo Lorenza C
Home Financials for this Owner
Home Financials are based on the most recent Mortgage that was taken out on this home.
Original Mortgage
$243,523
Interest Rate
4.67%
Mortgage Type
New Conventional
Purchase Details
Closed on
Sep 23, 2004
Sold by
Kb Home North Bay Inc
Bought by
Olifir Pavlo S and Olifer Irina
Home Financials for this Owner
Home Financials are based on the most recent Mortgage that was taken out on this home.
Original Mortgage
$312,825
Interest Rate
3.81%
Mortgage Type
Purchase Money Mortgage
Create a Home Valuation Report for This Property
The Home Valuation Report is an in-depth analysis detailing your home's value as well as a comparison with similar homes in the area
Home Values in the Area
Average Home Value in this Area
Purchase History
| Date | Buyer | Sale Price | Title Company |
|---|---|---|---|
| Arevalo Living Trust | -- | None Listed On Document | |
| Arevalo Emilio M | $235,000 | Fidelity National Title Co | |
| Olifir Pavlo S | $391,500 | First American Title |
Source: Public Records
Mortgage History
| Date | Status | Borrower | Loan Amount |
|---|---|---|---|
| Previous Owner | Arevalo Emilio M | $243,523 | |
| Previous Owner | Olifir Pavlo S | $312,825 |
Source: Public Records
Tax History Compared to Growth
Tax History
| Year | Tax Paid | Tax Assessment Tax Assessment Total Assessment is a certain percentage of the fair market value that is determined by local assessors to be the total taxable value of land and additions on the property. | Land | Improvement |
|---|---|---|---|---|
| 2025 | $7,298 | $301,066 | $96,082 | $204,984 |
| 2023 | $7,298 | $289,377 | $92,352 | $197,025 |
| 2022 | $7,033 | $283,704 | $90,542 | $193,162 |
| 2021 | $6,968 | $278,142 | $88,767 | $189,375 |
| 2020 | $6,925 | $275,291 | $87,857 | $187,434 |
| 2019 | $6,783 | $269,894 | $86,135 | $183,759 |
| 2018 | $6,637 | $264,603 | $84,447 | $180,156 |
| 2017 | $7,156 | $259,416 | $82,792 | $176,624 |
| 2016 | $6,983 | $254,330 | $81,169 | $173,161 |
| 2015 | $6,852 | $250,510 | $79,950 | $170,560 |
| 2014 | $6,700 | $245,603 | $78,384 | $167,219 |
Source: Public Records
Map
Nearby Homes
- 961 Silverton Cir
- 1141 Southwick Ln
- 1012 Silverton Cir
- 542 Longmeadow Ln
- 665 Equinox Loop
- 145 Northfield Ct
- 626 Equinox Loop
- 2000 Sierra View Cir Unit 1
- 440 Shadow Lake Ct
- 838 Farrington Ln
- 668 Whitfield Ln
- 1259 Shirley Way
- 1342 Landmark Cir
- 1336 Landmark Cir
- 1245 Landmark Cir
- 1524 Green Ravine Dr
- 926 Gold Nugget Cir
- 1096 Landmark Cir
- 1240 Landmark Cir
- 938 Gold Nugget Cir
- 114 Marland Ct
- 122 Marland Ct
- 117 Marland Ct
- 110 Marland Ct
- 213 Canon Ct
- 209 Canon Ct
- 1136 Kensington Ln
- 121 Marland Ct
- 1144 Kensington Ln
- 1128 Kensington Ln
- 205 Canon Ct
- 106 Marland Ct
- 125 Marland Ct
- 113 Marland Ct
- 1152 Kensington Ln
- 1120 Kensington Ln
- 656 Newbridge Ln
- 648 Newbridge Ln
- 109 Marland Ct
- 664 Newbridge Ln