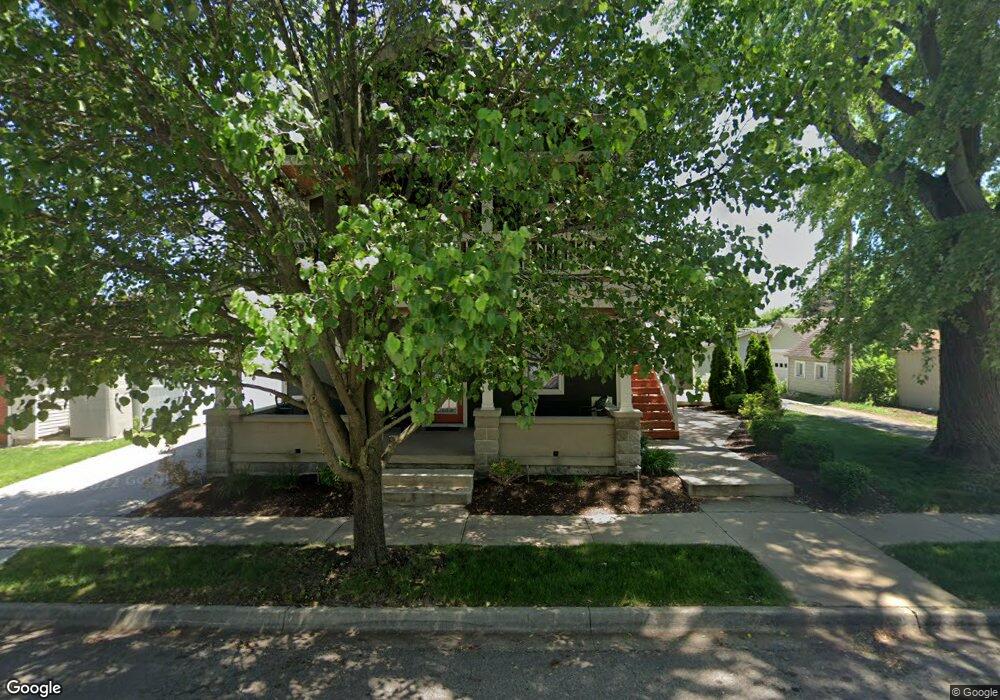
118 N 4th St Tipp City, OH 45371
Estimated Value: $175,302 - $325,000
3
Beds
3
Baths
2,200
Sq Ft
$104/Sq Ft
Est. Value
About This Home
This home is located at 118 N 4th St, Tipp City, OH 45371 and is currently estimated at $228,326, approximately $103 per square foot. 118 N 4th St is a home located in Miami County with nearby schools including Broadway Elementary School, Nevin Coppock Elementary School, and L. T. Ball Intermediate School.
Ownership History
Date
Name
Owned For
Owner Type
Purchase Details
Closed on
Dec 2, 2024
Sold by
Lee Paul D and Lee Kathy L
Bought by
Lee Group Enterprises Llc
Current Estimated Value
Purchase Details
Closed on
Jun 22, 2005
Sold by
Cool Wilbur S and Cool Thelma J
Bought by
Lee Paul D and Lee Kathy L
Home Financials for this Owner
Home Financials are based on the most recent Mortgage that was taken out on this home.
Original Mortgage
$72,000
Interest Rate
5.87%
Mortgage Type
New Conventional
Purchase Details
Closed on
Jan 1, 1978
Bought by
Cool Wilbur S
Create a Home Valuation Report for This Property
The Home Valuation Report is an in-depth analysis detailing your home's value as well as a comparison with similar homes in the area
Home Values in the Area
Average Home Value in this Area
Purchase History
| Date | Buyer | Sale Price | Title Company |
|---|---|---|---|
| Lee Group Enterprises Llc | -- | None Listed On Document | |
| Lee Group Enterprises Llc | -- | None Listed On Document | |
| Lee Paul D | $90,000 | -- | |
| Cool Wilbur S | $34,900 | -- |
Source: Public Records
Mortgage History
| Date | Status | Borrower | Loan Amount |
|---|---|---|---|
| Previous Owner | Lee Paul D | $72,000 |
Source: Public Records
Tax History Compared to Growth
Tax History
| Year | Tax Paid | Tax Assessment Tax Assessment Total Assessment is a certain percentage of the fair market value that is determined by local assessors to be the total taxable value of land and additions on the property. | Land | Improvement |
|---|---|---|---|---|
| 2024 | $2,872 | $56,530 | $10,750 | $45,780 |
| 2023 | $2,872 | $56,530 | $10,750 | $45,780 |
| 2022 | $2,628 | $56,530 | $10,750 | $45,780 |
| 2021 | $2,228 | $43,470 | $8,260 | $35,210 |
| 2020 | $2,255 | $43,470 | $8,260 | $35,210 |
| 2019 | $2,275 | $43,470 | $8,260 | $35,210 |
| 2018 | $1,745 | $31,120 | $8,930 | $22,190 |
| 2017 | $1,752 | $31,120 | $8,930 | $22,190 |
| 2016 | $1,696 | $31,120 | $8,930 | $22,190 |
| 2015 | $1,485 | $28,810 | $8,260 | $20,550 |
| 2014 | $1,485 | $28,810 | $8,260 | $20,550 |
| 2013 | $1,493 | $28,810 | $8,260 | $20,550 |
Source: Public Records
Map
Nearby Homes