Estimated Value: $138,000 - $178,000
2
Beds
3
Baths
1,260
Sq Ft
$125/Sq Ft
Est. Value
About This Home
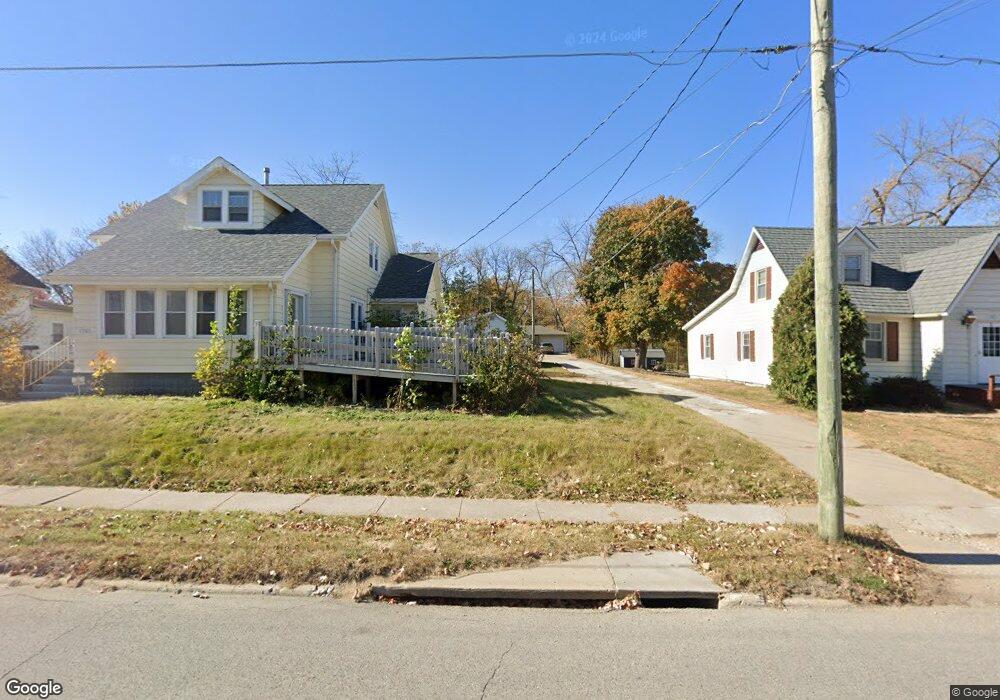
This home is located at 118 N Main St, Traer, IA 50675 and is currently estimated at $157,813, approximately $125 per square foot. 118 N Main St is a home with nearby schools including North Tama Elementary School and North Tama High School.
Ownership History
Date
Name
Owned For
Owner Type
Purchase Details
Closed on
Sep 26, 2023
Sold by
Popelka Diane M
Bought by
Hemann Denise and Popelka Rick
Current Estimated Value
Purchase Details
Closed on
Nov 15, 2006
Sold by
Benda Milo J and Benda Midred L
Bought by
Popelka Richard D and Popelka Diane M
Home Financials for this Owner
Home Financials are based on the most recent Mortgage that was taken out on this home.
Original Mortgage
$63,600
Interest Rate
6.36%
Mortgage Type
New Conventional
Create a Home Valuation Report for This Property
The Home Valuation Report is an in-depth analysis detailing your home's value as well as a comparison with similar homes in the area
Home Values in the Area
Average Home Value in this Area
Purchase History
| Date | Buyer | Sale Price | Title Company |
|---|---|---|---|
| Hemann Denise | -- | None Listed On Document | |
| Popelka Richard D | $85,750 | None Available |
Source: Public Records
Mortgage History
| Date | Status | Borrower | Loan Amount |
|---|---|---|---|
| Previous Owner | Popelka Richard D | $63,600 |
Source: Public Records
Tax History Compared to Growth
Tax History
| Year | Tax Paid | Tax Assessment Tax Assessment Total Assessment is a certain percentage of the fair market value that is determined by local assessors to be the total taxable value of land and additions on the property. | Land | Improvement |
|---|---|---|---|---|
| 2024 | $2,506 | $136,520 | $2,620 | $133,900 |
| 2023 | $2,308 | $136,520 | $2,620 | $133,900 |
| 2022 | $2,126 | $124,920 | $2,620 | $122,300 |
| 2021 | $2,084 | $112,840 | $2,710 | $110,130 |
| 2020 | $18 | $105,570 | $2,710 | $102,860 |
| 2019 | $1,802 | $88,870 | $0 | $0 |
| 2018 | $1,736 | $88,870 | $0 | $0 |
| 2017 | $1,768 | $88,870 | $0 | $0 |
| 2016 | $1,628 | $88,870 | $2,090 | $86,780 |
| 2015 | $1,580 | $88,870 | $2,090 | $86,780 |
| 2014 | $1,580 | $88,810 | $2,780 | $86,030 |
Source: Public Records
Map
Nearby Homes