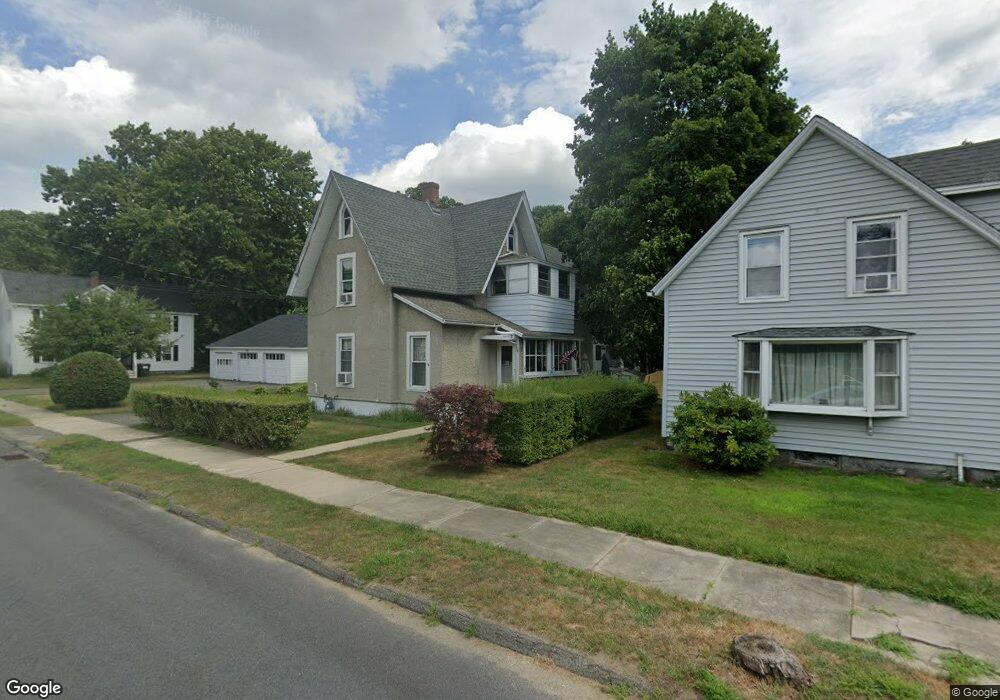
118 Oak St Winsted, CT 06098
Estimated Value: $216,000 - $281,000
3
Beds
2
Baths
1,606
Sq Ft
$158/Sq Ft
Est. Value
About This Home
This home is located at 118 Oak St, Winsted, CT 06098 and is currently estimated at $254,475, approximately $158 per square foot. 118 Oak St is a home located in Litchfield County with nearby schools including Explorations Charter School, St Anthony School, and The Gilbert School.
Ownership History
Date
Name
Owned For
Owner Type
Purchase Details
Closed on
Feb 8, 2016
Sold by
Halloran Michael
Bought by
Fracasso Donna L and Schultz John
Current Estimated Value
Home Financials for this Owner
Home Financials are based on the most recent Mortgage that was taken out on this home.
Original Mortgage
$137,365
Outstanding Balance
$109,611
Interest Rate
3.98%
Mortgage Type
FHA
Estimated Equity
$144,864
Purchase Details
Closed on
Mar 29, 2010
Sold by
Cianciolo Peter and Cianciolo Kris A
Bought by
Halloran Michael
Purchase Details
Closed on
Aug 13, 2001
Sold by
Gemetro Gayle and Gemetro William
Bought by
Cianciolo Peter
Home Financials for this Owner
Home Financials are based on the most recent Mortgage that was taken out on this home.
Original Mortgage
$78,400
Interest Rate
7.1%
Create a Home Valuation Report for This Property
The Home Valuation Report is an in-depth analysis detailing your home's value as well as a comparison with similar homes in the area
Home Values in the Area
Average Home Value in this Area
Purchase History
| Date | Buyer | Sale Price | Title Company |
|---|---|---|---|
| Fracasso Donna L | $139,900 | -- | |
| Fracasso Donna L | $139,900 | -- | |
| Halloran Michael | $80,000 | -- | |
| Halloran Michael | $80,000 | -- | |
| Cianciolo Peter | $79,700 | -- |
Source: Public Records
Mortgage History
| Date | Status | Borrower | Loan Amount |
|---|---|---|---|
| Open | Fracasso Donna L | $137,365 | |
| Closed | Fracasso Donna L | $137,365 | |
| Previous Owner | Cianciolo Peter | $78,400 | |
| Previous Owner | Cianciolo Peter | $3,000 |
Source: Public Records
Tax History Compared to Growth
Tax History
| Year | Tax Paid | Tax Assessment Tax Assessment Total Assessment is a certain percentage of the fair market value that is determined by local assessors to be the total taxable value of land and additions on the property. | Land | Improvement |
|---|---|---|---|---|
| 2025 | $3,602 | $123,480 | $22,960 | $100,520 |
| 2024 | $3,364 | $123,480 | $22,960 | $100,520 |
| 2023 | $3,259 | $123,480 | $22,960 | $100,520 |
| 2022 | $3,057 | $91,140 | $16,660 | $74,480 |
| 2021 | $3,057 | $91,140 | $16,660 | $74,480 |
| 2020 | $3,057 | $91,140 | $16,660 | $74,480 |
| 2019 | $3,057 | $91,140 | $16,660 | $74,480 |
| 2018 | $3,057 | $91,140 | $16,660 | $74,480 |
| 2017 | $2,892 | $86,240 | $16,660 | $69,580 |
| 2016 | $2,756 | $82,180 | $16,660 | $65,520 |
| 2015 | $2,687 | $82,180 | $16,660 | $65,520 |
| 2014 | $2,622 | $82,180 | $16,660 | $65,520 |
Source: Public Records
Map
Nearby Homes
- 114 Oak St
- 106 Oak St Unit 108
- 98 Wetmore Ave
- 75 Walnut St
- 81 Walnut St
- 109 Holabird Ave Unit 111
- 114 Wetmore Ave
- 117 Holabird Ave
- 69 Walnut St
- 103 Wetmore Ave
- 99 Holabird Ave
- 97 Wetmore Ave
- 93 Wetmore Ave
- 87 Walnut St
- 78 Walnut St
- 74 Walnut St
- 127 Holabird Ave
- 115 Wetmore Ave
- 106 Holabird Ave
- 70 Walnut St