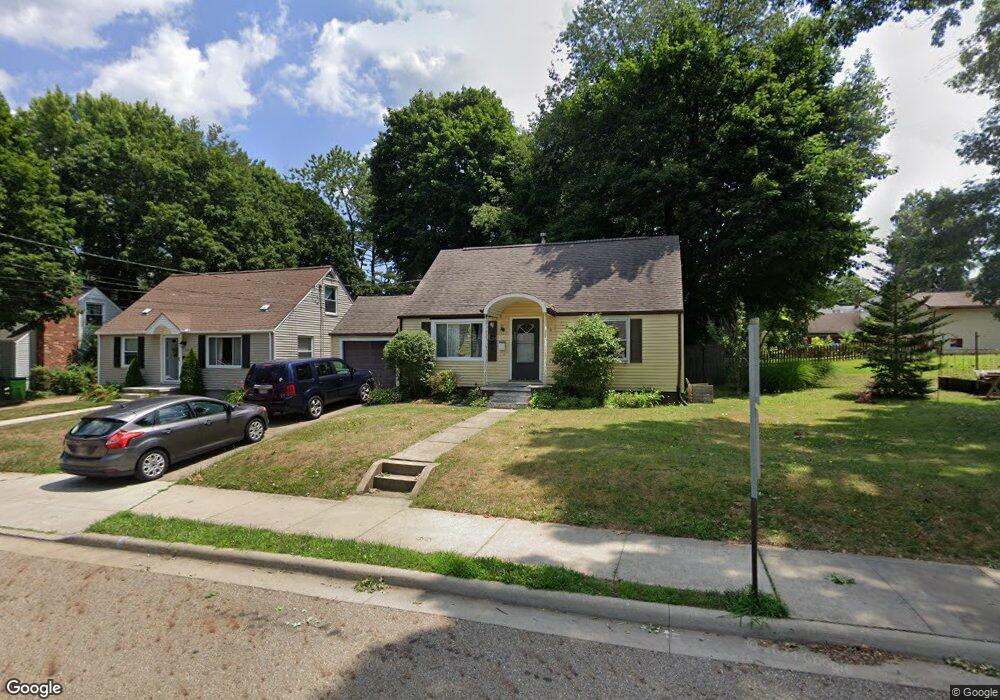
118 Parkview Ave NW North Canton, OH 44720
Estimated Value: $183,000 - $205,000
3
Beds
1
Bath
1,152
Sq Ft
$167/Sq Ft
Est. Value
About This Home
This home is located at 118 Parkview Ave NW, North Canton, OH 44720 and is currently estimated at $192,556, approximately $167 per square foot. 118 Parkview Ave NW is a home located in Stark County with nearby schools including Orchard Hill Intermediate School, North Canton Middle School, and Hoover High School.
Ownership History
Date
Name
Owned For
Owner Type
Purchase Details
Closed on
Aug 13, 2021
Sold by
Freeman Jonathan
Bought by
Foster Avenue Properties Llc
Current Estimated Value
Home Financials for this Owner
Home Financials are based on the most recent Mortgage that was taken out on this home.
Original Mortgage
$140,000
Outstanding Balance
$127,303
Interest Rate
2.9%
Mortgage Type
Purchase Money Mortgage
Estimated Equity
$65,253
Purchase Details
Closed on
Mar 8, 2019
Sold by
Stepanic Kimberly
Bought by
Burch Mark E
Purchase Details
Closed on
Jul 10, 2015
Sold by
Burch Sandra S
Bought by
Burch Mark E
Home Financials for this Owner
Home Financials are based on the most recent Mortgage that was taken out on this home.
Original Mortgage
$117,000
Interest Rate
4.01%
Mortgage Type
Seller Take Back
Create a Home Valuation Report for This Property
The Home Valuation Report is an in-depth analysis detailing your home's value as well as a comparison with similar homes in the area
Home Values in the Area
Average Home Value in this Area
Purchase History
| Date | Buyer | Sale Price | Title Company |
|---|---|---|---|
| Foster Avenue Properties Llc | $140,000 | None Available | |
| Freeman Jonathan | $110,000 | None Available | |
| Burch Mark E | -- | None Available | |
| Burch Mark E | $40,000 | Attorney | |
| Burch Sandra S | $119,000 | Attorney |
Source: Public Records
Mortgage History
| Date | Status | Borrower | Loan Amount |
|---|---|---|---|
| Open | Foster Avenue Properties Llc | $140,000 | |
| Previous Owner | Burch Sandra S | $117,000 |
Source: Public Records
Tax History Compared to Growth
Tax History
| Year | Tax Paid | Tax Assessment Tax Assessment Total Assessment is a certain percentage of the fair market value that is determined by local assessors to be the total taxable value of land and additions on the property. | Land | Improvement |
|---|---|---|---|---|
| 2025 | -- | $47,360 | $11,590 | $35,770 |
| 2024 | -- | $47,360 | $11,590 | $35,770 |
| 2023 | $2,387 | $43,720 | $9,210 | $34,510 |
| 2022 | $1,149 | $43,720 | $9,210 | $34,510 |
| 2021 | $2,008 | $39,560 | $9,210 | $30,350 |
| 2020 | $1,929 | $34,130 | $8,020 | $26,110 |
| 2019 | $1,805 | $34,140 | $8,020 | $26,120 |
| 2018 | $1,872 | $34,140 | $8,020 | $26,120 |
| 2017 | $1,696 | $32,380 | $7,420 | $24,960 |
| 2016 | $1,703 | $32,380 | $7,420 | $24,960 |
| 2015 | $1,436 | $27,200 | $7,420 | $19,780 |
| 2014 | $1,460 | $25,810 | $7,040 | $18,770 |
| 2013 | $715 | $25,810 | $7,040 | $18,770 |
Source: Public Records
Map
Nearby Homes
- 624 Portage St NW
- 742 Portage St NW
- 455 Royer Ave NW
- 727 Lorena St SW
- 0 W Maple St Unit 5135089
- 608 Werstler Ave NW
- 404 7th St NW
- 140 5th St NE
- 1171 Terrace Rd NW
- 1222 W Maple St Unit 6A
- 1246 W Maple St Unit 4A
- 1236 W Maple St
- 253 Glenwood St SW
- 404 Cordelia St SW
- 406 Hower St NE
- 1138 Lindy Lane Ave SW
- 448 Hower St NE
- 1015 Lois Ave NW
- 714 Pershing Ave SE
- 1263 Los Angeles Blvd NW
- 124 Parkview Ave NW
- 128 Parkview Ave NW
- 605 W Maple St
- 601 W Maple St
- 611 W Maple St
- 553 W Maple St
- 134 Parkview Ave NW
- 117 Willaman Ave NW
- 619 W Maple St
- 123 Parkview Ave NW
- 547 W Maple St
- 140 Parkview Ave NW
- 125 Willaman Ave NW
- 625 W Maple St
- 129 Parkview Ave NW
- 543 W Maple St
- 629 W Maple St
- 146 Parkview Ave NW
- 135 Willaman Ave NW
- 116 Donner Ave NW