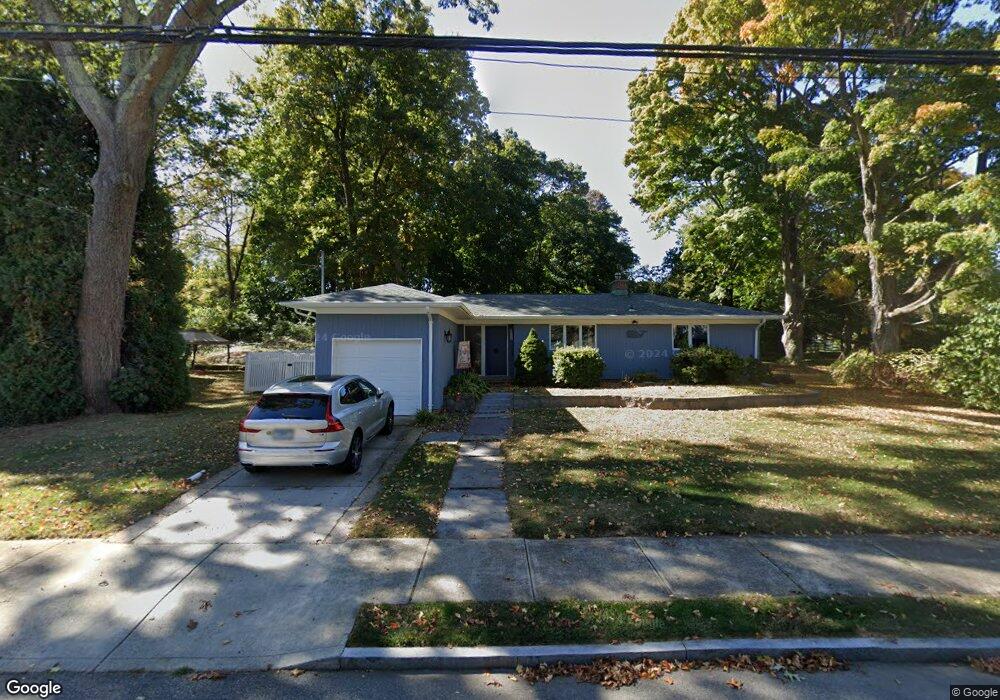
118 Parkway S New London, CT 06320
South New London NeighborhoodEstimated Value: $392,000 - $502,000
2
Beds
2
Baths
1,218
Sq Ft
$371/Sq Ft
Est. Value
About This Home
This home is located at 118 Parkway S, New London, CT 06320 and is currently estimated at $452,053, approximately $371 per square foot. 118 Parkway S is a home located in New London County with nearby schools including Harbor Elementary School, Bennie Dover Jackson Middle School, and New London High School.
Ownership History
Date
Name
Owned For
Owner Type
Purchase Details
Closed on
Jun 16, 2000
Sold by
Yarsley Dorothy E
Bought by
Oneill Mary Ellen
Current Estimated Value
Home Financials for this Owner
Home Financials are based on the most recent Mortgage that was taken out on this home.
Original Mortgage
$116,000
Interest Rate
8.24%
Create a Home Valuation Report for This Property
The Home Valuation Report is an in-depth analysis detailing your home's value as well as a comparison with similar homes in the area
Home Values in the Area
Average Home Value in this Area
Purchase History
| Date | Buyer | Sale Price | Title Company |
|---|---|---|---|
| Oneill Mary Ellen | $145,000 | -- | |
| Oneill Mary Ellen | $145,000 | -- |
Source: Public Records
Mortgage History
| Date | Status | Borrower | Loan Amount |
|---|---|---|---|
| Closed | Oneill Mary Ellen | $98,100 | |
| Closed | Oneill Mary Ellen | $125,600 | |
| Closed | Oneill Mary Ellen | $128,000 | |
| Closed | Oneill Mary Ellen | $116,000 |
Source: Public Records
Tax History Compared to Growth
Tax History
| Year | Tax Paid | Tax Assessment Tax Assessment Total Assessment is a certain percentage of the fair market value that is determined by local assessors to be the total taxable value of land and additions on the property. | Land | Improvement |
|---|---|---|---|---|
| 2025 | $7,009 | $257,700 | $89,900 | $167,800 |
| 2024 | $5,921 | $215,300 | $89,900 | $125,400 |
| 2023 | $5,078 | $136,360 | $66,710 | $69,650 |
| 2022 | $5,088 | $136,360 | $66,710 | $69,650 |
| 2021 | $5,175 | $136,360 | $66,710 | $69,650 |
| 2020 | $5,208 | $136,360 | $66,710 | $69,650 |
| 2019 | $5,441 | $136,360 | $66,710 | $69,650 |
| 2018 | $5,202 | $118,930 | $58,870 | $60,060 |
| 2017 | $5,264 | $118,930 | $58,870 | $60,060 |
| 2016 | $4,812 | $118,930 | $58,870 | $60,060 |
| 2015 | $4,616 | $116,900 | $58,870 | $58,030 |
| 2014 | $4,006 | $116,900 | $58,870 | $58,030 |
Source: Public Records
Map
Nearby Homes
- 11 Glenwood Park S
- 17 Henderson Rd
- 899 Ocean Ave
- 925 Pequot Ave
- 845 Ocean Ave
- 597 Pequot Ave
- 1092 Ocean Ave
- 993 Pequot Ave
- 41 Niles Hill Rd
- 107 Niles Hill Rd Unit A
- 14 Park St
- 1176 Ocean Ave
- 41 Stuart Ave
- 12 Greenfield St
- 57 Westridge Rd Unit B2
- 4 Ridgewood Ave
- 2 Forest St
- 142 Plant St
- 2 Maginnis Pkwy
- 165 Plant St