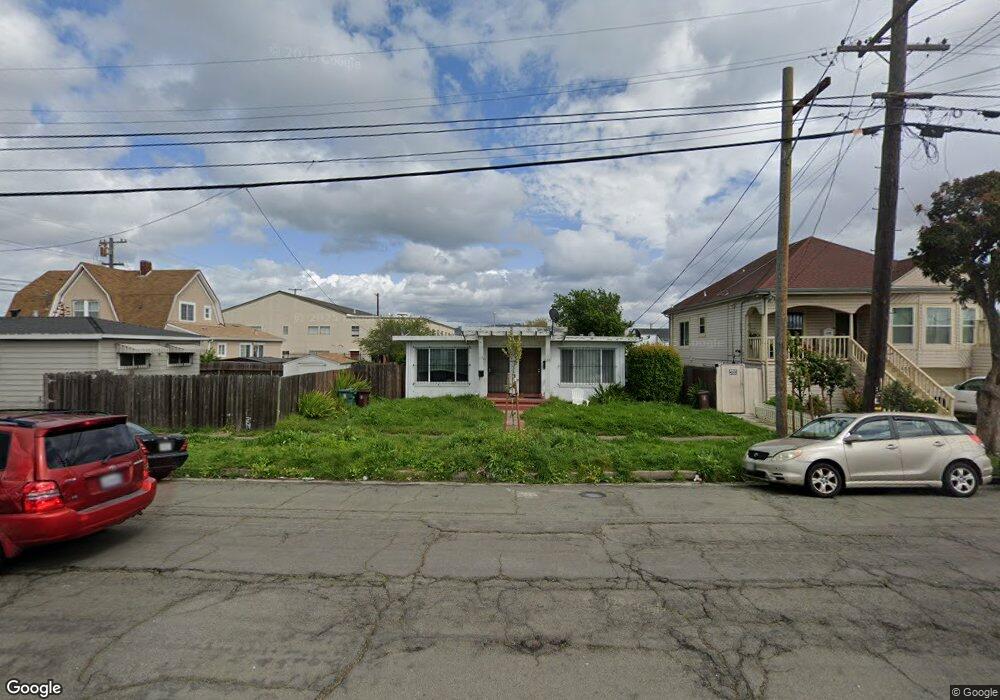
118 S 12th St Richmond, CA 94804
Coronado NeighborhoodEstimated Value: $491,000 - $548,000
2
Beds
2
Baths
1,280
Sq Ft
$400/Sq Ft
Est. Value
About This Home
This home is located at 118 S 12th St, Richmond, CA 94804 and is currently estimated at $511,470, approximately $399 per square foot. 118 S 12th St is a home located in Contra Costa County with nearby schools including Nystrom Elementary School, Lovonya DeJean Middle School, and John F. Kennedy High School.
Ownership History
Date
Name
Owned For
Owner Type
Purchase Details
Closed on
Sep 13, 2005
Sold by
Robinson Vernon V and Jones Robinson Olivia
Bought by
Robinson Vernon V and Jones Robinson Olivia
Current Estimated Value
Purchase Details
Closed on
Apr 3, 2001
Sold by
Williams Charles E and Williams Vallery L
Bought by
Francis Helen
Home Financials for this Owner
Home Financials are based on the most recent Mortgage that was taken out on this home.
Original Mortgage
$104,000
Outstanding Balance
$51,402
Interest Rate
11.75%
Mortgage Type
Purchase Money Mortgage
Estimated Equity
$460,068
Create a Home Valuation Report for This Property
The Home Valuation Report is an in-depth analysis detailing your home's value as well as a comparison with similar homes in the area
Home Values in the Area
Average Home Value in this Area
Purchase History
| Date | Buyer | Sale Price | Title Company |
|---|---|---|---|
| Robinson Vernon V | -- | -- | |
| Francis Helen | $130,000 | American Title Co |
Source: Public Records
Mortgage History
| Date | Status | Borrower | Loan Amount |
|---|---|---|---|
| Open | Francis Helen | $104,000 |
Source: Public Records
Tax History
| Year | Tax Paid | Tax Assessment Tax Assessment Total Assessment is a certain percentage of the fair market value that is determined by local assessors to be the total taxable value of land and additions on the property. | Land | Improvement |
|---|---|---|---|---|
| 2025 | $3,256 | $53,995 | $20,939 | $33,056 |
| 2024 | $3,098 | $52,937 | $20,529 | $32,408 |
| 2023 | $3,098 | $51,900 | $20,127 | $31,773 |
| 2022 | $2,972 | $50,883 | $19,733 | $31,150 |
| 2021 | $2,861 | $49,887 | $19,347 | $30,540 |
| 2019 | $2,659 | $48,409 | $18,774 | $29,635 |
| 2018 | $2,547 | $47,460 | $18,406 | $29,054 |
| 2017 | $2,451 | $46,531 | $18,046 | $28,485 |
| 2016 | $2,358 | $45,620 | $17,693 | $27,927 |
| 2015 | $2,286 | $44,936 | $17,428 | $27,508 |
| 2014 | $2,302 | $44,057 | $17,087 | $26,970 |
Source: Public Records
Map
Nearby Homes
Your Personal Tour Guide
Ask me questions while you tour the home.