Estimated Value: $439,539 - $490,000
3
Beds
1
Bath
2,276
Sq Ft
$206/Sq Ft
Est. Value
About This Home
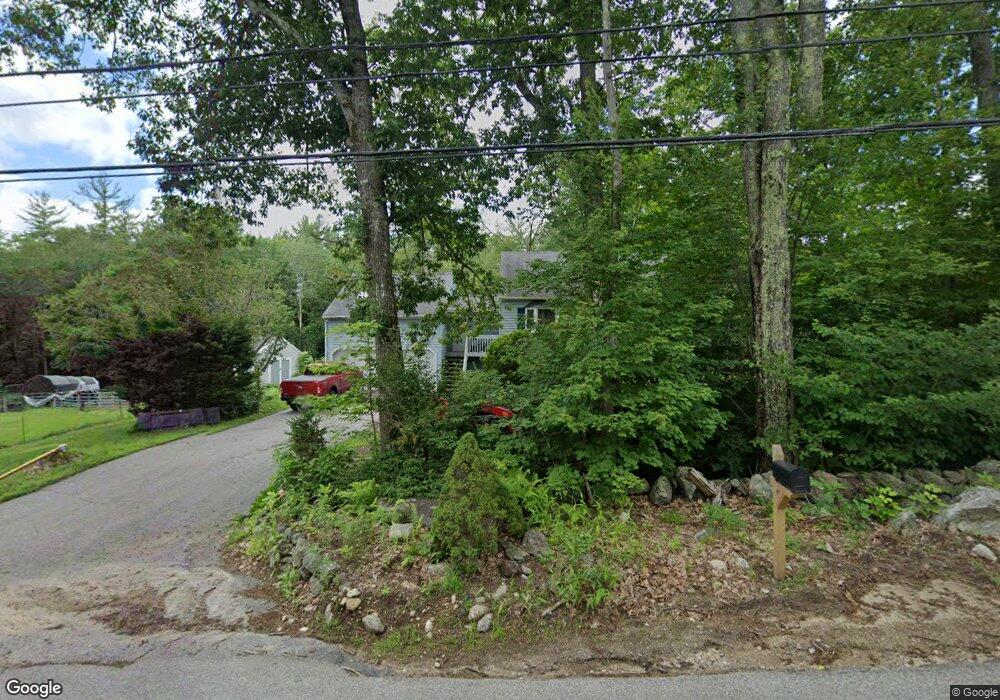
This home is located at 118 S Sugar Hill Rd, Weare, NH 03281 and is currently estimated at $467,885, approximately $205 per square foot. 118 S Sugar Hill Rd is a home located in Hillsborough County with nearby schools including Center Woods Elementary School, Weare Middle School, and John Stark Regional High School.
Ownership History
Date
Name
Owned For
Owner Type
Purchase Details
Closed on
Jan 28, 2011
Sold by
Mcmahon Raymond J
Bought by
Cobb Laurent U
Current Estimated Value
Home Financials for this Owner
Home Financials are based on the most recent Mortgage that was taken out on this home.
Original Mortgage
$184,344
Outstanding Balance
$126,441
Interest Rate
4.83%
Mortgage Type
Purchase Money Mortgage
Estimated Equity
$341,444
Purchase Details
Closed on
Oct 12, 2010
Sold by
Hoyt William F
Bought by
Mcmahon Raymond J
Purchase Details
Closed on
Aug 27, 2004
Sold by
Lofaro Genevieve L and Lofaro Darrin M
Bought by
Hoyt William F and Hoyt Kelly E
Purchase Details
Closed on
Oct 3, 2001
Sold by
Stanley Noreen P
Bought by
Lofaro Genevieve L and Lofaro Darrin M
Purchase Details
Closed on
Oct 2, 2000
Sold by
Kanellos John D
Bought by
Stanley Peter G and Stanley Noreen P
Create a Home Valuation Report for This Property
The Home Valuation Report is an in-depth analysis detailing your home's value as well as a comparison with similar homes in the area
Home Values in the Area
Average Home Value in this Area
Purchase History
| Date | Buyer | Sale Price | Title Company |
|---|---|---|---|
| Cobb Laurent U | $177,900 | -- | |
| Mcmahon Raymond J | $121,000 | -- | |
| Hoyt William F | $249,000 | -- | |
| Lofaro Genevieve L | $165,000 | -- | |
| Stanley Peter G | $149,900 | -- |
Source: Public Records
Mortgage History
| Date | Status | Borrower | Loan Amount |
|---|---|---|---|
| Open | Stanley Peter G | $184,344 | |
| Previous Owner | Stanley Peter G | $220,000 | |
| Previous Owner | Stanley Peter G | $55,000 |
Source: Public Records
Tax History Compared to Growth
Tax History
| Year | Tax Paid | Tax Assessment Tax Assessment Total Assessment is a certain percentage of the fair market value that is determined by local assessors to be the total taxable value of land and additions on the property. | Land | Improvement |
|---|---|---|---|---|
| 2024 | $6,101 | $299,200 | $108,800 | $190,400 |
| 2023 | $5,584 | $296,400 | $108,800 | $187,600 |
| 2022 | $5,157 | $296,400 | $108,800 | $187,600 |
| 2021 | $5,098 | $296,400 | $108,800 | $187,600 |
| 2020 | $4,855 | $202,700 | $77,300 | $125,400 |
| 2019 | $4,806 | $202,700 | $77,300 | $125,400 |
| 2018 | $4,698 | $204,000 | $77,300 | $126,700 |
| 2016 | $4,563 | $204,000 | $77,300 | $126,700 |
| 2015 | $4,536 | $202,400 | $77,300 | $125,100 |
| 2014 | $4,495 | $202,400 | $77,300 | $125,100 |
| 2013 | $4,402 | $202,400 | $77,300 | $125,100 |
Source: Public Records
Map
Nearby Homes
- 0 Als Dr Unit 196
- 57 Lyndsey Ln
- 40 N Woods Rd
- 0 Huntington Hill Rd Unit 69
- 464 Irish Hill Rd
- 849 River Rd
- 256 Irish Hill Rd
- 541 South Rd
- 256-0-17 Jewett Rd
- 92 Woodbury Rd
- 1003 School St
- 15 Robert Rogers Rd
- I3-03-05 Clinton St
- 102 Fieldstone Rd
- 0 Farrington Corner Rd Unit 14
- 10 Sap House Rd
- 250 Grapevine Rd
- 89 Old Henniker Rd
- 656 Dolly Rd
- 167 Branch Londonderry Turnpike
- 114 S Sugar Hill Rd
- 119 S Sugar Hill Rd
- 111 S Sugar Hill Rd
- 129 S Sugar Hill Rd
- 104 S Sugar Hill Rd
- 136 S Sugar Hill Rd
- 52 Als Dr
- 66 Als Dr
- 93 S Sugar Hill Rd
- 144 S Sugar Hill Rd
- 90 S Sugar Hill Rd
- 53 Als Dr
- 22 Als Dr
- 87 S Sugar Hill Rd
- 152 S Sugar Hill Rd
- 37 Als Dr
- 80 S Sugar Hill Rd
- 159 S Sugar Hill Rd
- 81 S Sugar Hill Rd
- 25 Als Dr