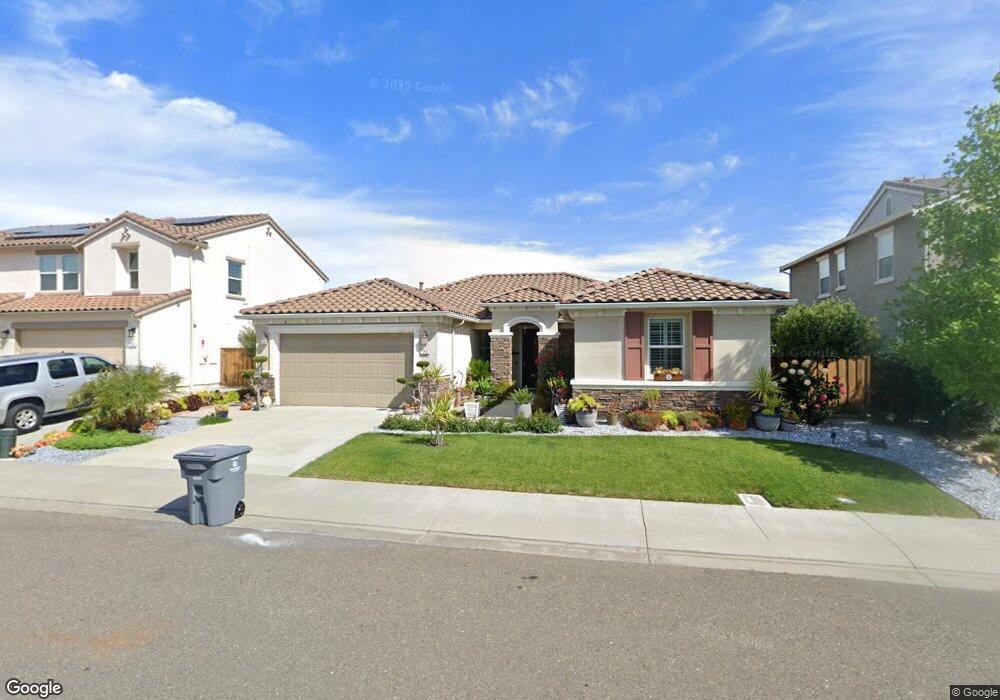
118 Shubin Way Vacaville, CA 95687
Estimated Value: $665,739 - $839,000
4
Beds
2
Baths
1,957
Sq Ft
$383/Sq Ft
Est. Value
About This Home
This home is located at 118 Shubin Way, Vacaville, CA 95687 and is currently estimated at $749,935, approximately $383 per square foot. 118 Shubin Way is a home located in Solano County with nearby schools including Cambridge Elementary School, Golden West Middle School, and Vanden High School.
Ownership History
Date
Name
Owned For
Owner Type
Purchase Details
Closed on
Aug 25, 2021
Sold by
Nono Maria Christina and Nono Fernando
Bought by
Nono Maria Christina and Nono Maria Christina
Current Estimated Value
Home Financials for this Owner
Home Financials are based on the most recent Mortgage that was taken out on this home.
Original Mortgage
$396,500
Outstanding Balance
$360,785
Interest Rate
2.8%
Mortgage Type
New Conventional
Estimated Equity
$389,150
Purchase Details
Closed on
Feb 16, 2019
Sold by
Nono Fernando C and Nono Maria Christina P
Bought by
Nono Fernando C and Nono Maria Christina P
Purchase Details
Closed on
Oct 27, 2016
Sold by
Kb Home South Bay Inc
Bought by
Nono Maria Christina P and Nono Fernando C
Home Financials for this Owner
Home Financials are based on the most recent Mortgage that was taken out on this home.
Original Mortgage
$417,000
Interest Rate
3.42%
Mortgage Type
New Conventional
Create a Home Valuation Report for This Property
The Home Valuation Report is an in-depth analysis detailing your home's value as well as a comparison with similar homes in the area
Home Values in the Area
Average Home Value in this Area
Purchase History
| Date | Buyer | Sale Price | Title Company |
|---|---|---|---|
| Nono Maria Christina | -- | Chicago Title Company | |
| Nono Maria Christina | -- | Chicago Title Company | |
| Nono Fernando C | -- | None Available | |
| Nono Maria Christina P | $544,500 | First American Title Company |
Source: Public Records
Mortgage History
| Date | Status | Borrower | Loan Amount |
|---|---|---|---|
| Open | Nono Maria Christina | $396,500 | |
| Closed | Nono Maria Christina P | $417,000 |
Source: Public Records
Tax History Compared to Growth
Tax History
| Year | Tax Paid | Tax Assessment Tax Assessment Total Assessment is a certain percentage of the fair market value that is determined by local assessors to be the total taxable value of land and additions on the property. | Land | Improvement |
|---|---|---|---|---|
| 2025 | $9,302 | $631,469 | $174,085 | $457,384 |
| 2024 | $9,302 | $619,088 | $170,672 | $448,416 |
| 2023 | $9,118 | $606,950 | $167,326 | $439,624 |
| 2022 | $9,015 | $595,050 | $164,046 | $431,004 |
| 2021 | $8,974 | $583,383 | $160,830 | $422,553 |
| 2020 | $8,875 | $577,402 | $159,181 | $418,221 |
| 2019 | $8,690 | $566,081 | $156,060 | $410,021 |
| 2018 | $8,469 | $554,982 | $153,000 | $401,982 |
| 2017 | $8,142 | $544,100 | $150,000 | $394,100 |
| 2016 | $1,459 | $111,842 | $111,842 | $0 |
| 2015 | $1,395 | $110,163 | $110,163 | $0 |
Source: Public Records
Map
Nearby Homes
- 357 Colonial Cir
- 472 Harvest Cir
- 854 Owl Cir
- 136 Brockton Ct
- 660 Sparrowhawk Dr
- 723 Chateau Cir
- 630 Purple Martin Dr
- 232 Riverdale Ave
- 190 Fairview Dr
- 106 Village Ct
- 3642 Alamo Dr
- 1136 Woodridge Dr
- 360 Baler Cir
- 4054 Camden Ct
- 606 Saint Andrews Dr
- 3510 Nut Tree Rd
- 1084 Woodridge Dr
- 2600 Nut Tree Rd
- 2031 Newcastle Dr
- 236 Cogburn Way
- 124 Shubin Way
- 112 Shubin Way
- 4036 Madeline Ct
- 130 Shubin Way
- 5006 Avery Ct
- 119 Shubin Way
- 125 Shubin Way
- 113 Shubin Way
- 5012 Avery Ct
- 4030 Madeline Ct
- 131 Shubin Way
- 4000 Madeline Ct
- 4006 Madeline Ct
- 4012 Madeline Ct
- 137 Shubin Way
- 5018 Avery Ct
- 4024 Madeline Ct
- 142 Shubin Way
- 200 Joyce Dr
- 225 Joyce Dr