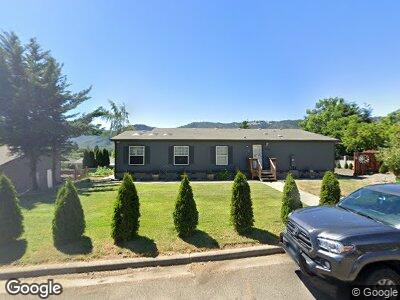
118 Sunwood Ct Myrtle Creek, OR 97457
Tri-City NeighborhoodEstimated Value: $321,370 - $370,000
3
Beds
2
Baths
2,004
Sq Ft
$170/Sq Ft
Est. Value
About This Home
This home is located at 118 Sunwood Ct, Myrtle Creek, OR 97457 and is currently estimated at $341,457, approximately $170 per square foot. 118 Sunwood Ct is a home located in Douglas County with nearby schools including South Umpqua High School.
Ownership History
Date
Name
Owned For
Owner Type
Purchase Details
Closed on
Jul 30, 2018
Sold by
Muyskens Richard G
Bought by
Mack Kenneth
Current Estimated Value
Home Financials for this Owner
Home Financials are based on the most recent Mortgage that was taken out on this home.
Original Mortgage
$176,739
Interest Rate
5.12%
Mortgage Type
FHA
Purchase Details
Closed on
Aug 2, 2006
Sold by
Hecox Roger W and Hecox Karen L
Bought by
Muyskens Richard G and Muyskens Emma B
Create a Home Valuation Report for This Property
The Home Valuation Report is an in-depth analysis detailing your home's value as well as a comparison with similar homes in the area
Home Values in the Area
Average Home Value in this Area
Purchase History
| Date | Buyer | Sale Price | Title Company |
|---|---|---|---|
| Mack Kenneth | $180,000 | None Available | |
| Muyskens Richard G | $215,000 | Douglas County Title Company |
Source: Public Records
Mortgage History
| Date | Status | Borrower | Loan Amount |
|---|---|---|---|
| Open | Mack Kenneth | $175,312 | |
| Closed | Mack Kenneth | $176,739 | |
| Previous Owner | Muyskens Richard G | $30,000 | |
| Previous Owner | Hecox Roger W | $25,000 |
Source: Public Records
Tax History Compared to Growth
Tax History
| Year | Tax Paid | Tax Assessment Tax Assessment Total Assessment is a certain percentage of the fair market value that is determined by local assessors to be the total taxable value of land and additions on the property. | Land | Improvement |
|---|---|---|---|---|
| 2024 | $1,836 | $192,663 | -- | -- |
| 2023 | $1,780 | $187,052 | $0 | $0 |
| 2022 | $1,740 | $181,604 | $0 | $0 |
| 2021 | $1,681 | $176,315 | $0 | $0 |
| 2020 | $1,474 | $166,501 | $0 | $0 |
| 2019 | $1,562 | $171,180 | $0 | $0 |
| 2018 | $1,485 | $166,015 | $0 | $0 |
| 2017 | $1,256 | $140,354 | $0 | $0 |
| 2016 | $1,203 | $135,046 | $0 | $0 |
| 2015 | $1,184 | $132,739 | $0 | $0 |
| 2014 | $1,304 | $147,070 | $0 | $0 |
| 2013 | -- | $142,598 | $0 | $0 |
Source: Public Records
Map
Nearby Homes