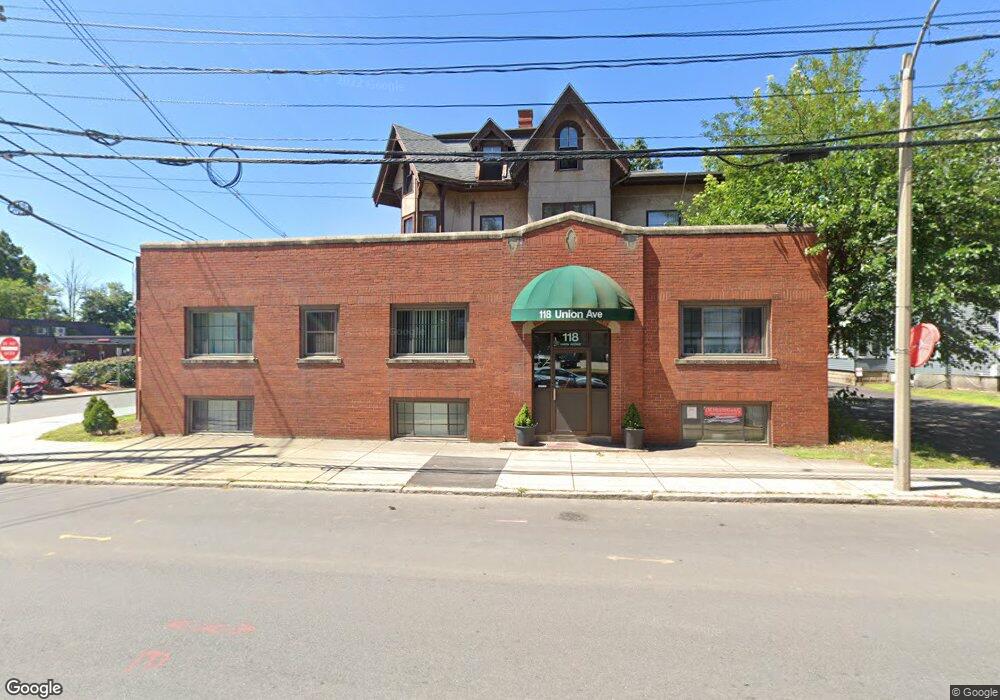
118 Union Ave Framingham, MA 01702
Estimated Value: $1,408,708
2
Beds
1
Bath
6,207
Sq Ft
$227/Sq Ft
Est. Value
About This Home
This home is located at 118 Union Ave, Framingham, MA 01702 and is currently estimated at $1,408,708, approximately $226 per square foot. 118 Union Ave is a home located in Middlesex County with nearby schools including Framingham High School, Happy Hollow School, and Saint Bridget School.
Ownership History
Date
Name
Owned For
Owner Type
Purchase Details
Closed on
Jun 1, 2007
Sold by
Union T and Kumar
Bought by
Union Rt and Ford
Current Estimated Value
Home Financials for this Owner
Home Financials are based on the most recent Mortgage that was taken out on this home.
Original Mortgage
$502,950
Outstanding Balance
$308,585
Interest Rate
6.24%
Mortgage Type
Commercial
Estimated Equity
$1,100,123
Purchase Details
Closed on
Apr 2, 2003
Sold by
Lafrance Katherine S
Bought by
Un T T and Un Tr
Home Financials for this Owner
Home Financials are based on the most recent Mortgage that was taken out on this home.
Original Mortgage
$200,000
Interest Rate
5.88%
Mortgage Type
Commercial
Purchase Details
Closed on
Aug 4, 2000
Sold by
Kendall Rt and Farrell
Bought by
S-Bnk Fram Union Llc
Home Financials for this Owner
Home Financials are based on the most recent Mortgage that was taken out on this home.
Original Mortgage
$1,597,016
Interest Rate
8.1%
Mortgage Type
Commercial
Create a Home Valuation Report for This Property
The Home Valuation Report is an in-depth analysis detailing your home's value as well as a comparison with similar homes in the area
Home Values in the Area
Average Home Value in this Area
Purchase History
| Date | Buyer | Sale Price | Title Company |
|---|---|---|---|
| Union Rt | $718,500 | -- | |
| Union Rt | $718,500 | -- | |
| Un T T | $390,000 | -- | |
| Un T T | $390,000 | -- | |
| S-Bnk Fram Union Llc | $1,597,016 | -- |
Source: Public Records
Mortgage History
| Date | Status | Borrower | Loan Amount |
|---|---|---|---|
| Open | Union Rt | $502,950 | |
| Closed | S-Bnk Fram Union Llc | $502,950 | |
| Previous Owner | Un T T | $200,000 | |
| Previous Owner | S-Bnk Fram Union Llc | $1,597,016 |
Source: Public Records
Tax History
| Year | Tax Paid | Tax Assessment Tax Assessment Total Assessment is a certain percentage of the fair market value that is determined by local assessors to be the total taxable value of land and additions on the property. | Land | Improvement |
|---|---|---|---|---|
| 2025 | -- | $979,700 | $159,300 | $820,400 |
| 2024 | -- | $922,200 | $160,100 | $762,100 |
| 2023 | $0 | $733,200 | $145,700 | $587,500 |
| 2022 | $0 | $682,500 | $132,300 | $550,200 |
| 2021 | $0 | $667,500 | $132,300 | $535,200 |
| 2020 | $0 | $706,300 | $132,300 | $574,000 |
| 2019 | $0 | $694,700 | $126,600 | $568,100 |
| 2018 | $0 | $1,111,800 | $143,300 | $968,500 |
| 2017 | -- | $780,900 | $143,300 | $637,600 |
| 2016 | -- | $596,200 | $125,200 | $471,000 |
| 2015 | -- | $596,100 | $120,500 | $475,600 |
Source: Public Records
Map
Nearby Homes
- 120 Franklin St
- 47 Clinton St
- 29 Gordon St Unit 107
- 342 Franklin St Unit St
- 129 Dennison Ave
- 29 Shawmut Terrace
- 18 Beaver Ct
- 17 Brigham Rd
- 144 Bishop St
- 25 Eames St
- 96 Mansfield St
- 292 Hollis St
- 92 Alexander St
- 10 Rhubena St
- 12 & 14 Waverly St
- 768 Waverley St
- 33 Stevens Rd
- 126 Beaver St Unit 5
- 50 Kittredge Rd
- 47 Bishop Dr
- 118 Union Ave Unit 19
- 118 Union Ave Unit 10
- 118 Union Ave Unit 1
- 100 Pearl St Unit 14
- 100 Pearl St Unit 10
- 100 Pearl St
- 100 Pearl St Unit 11
- 100 Pearl St Unit 12
- 7 Lexington St Unit B
- 7 Lexington St
- 115 Franklin St Unit 117
- 115 Franklin St Unit 2A
- 123 Franklin St
- 140 Union Ave Unit 11
- 140 Union Ave
- 4 Lexington St
- 5 Franklin Common Unit 5
- 5 Franklin Common Unit 6
- 5 Franklin Common
- 5 Franklin Common Unit 5-6
Your Personal Tour Guide
Ask me questions while you tour the home.