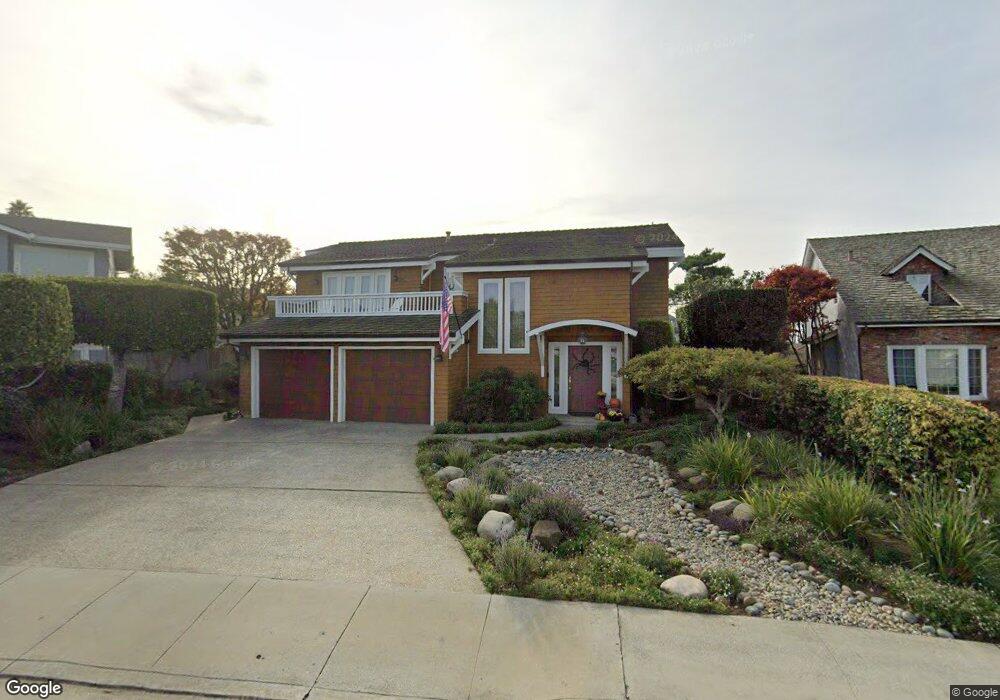
118 Via Trinita Aptos, CA 95003
Rio del Mar NeighborhoodEstimated Value: $2,207,000 - $2,560,000
3
Beds
3
Baths
3,001
Sq Ft
$768/Sq Ft
Est. Value
About This Home
This home is located at 118 Via Trinita, Aptos, CA 95003 and is currently estimated at $2,304,434, approximately $767 per square foot. 118 Via Trinita is a home located in Santa Cruz County with nearby schools including Rio Del Mar Elementary School, Aptos Junior High School, and Aptos High School.
Ownership History
Date
Name
Owned For
Owner Type
Purchase Details
Closed on
Dec 4, 2000
Sold by
Martinez Jose and Martinez Ellen H
Bought by
Martinez Jose and Martinez Ellen H
Current Estimated Value
Purchase Details
Closed on
May 20, 1999
Sold by
Lauran R
Bought by
Martinez Jose and Martinez Ellen
Home Financials for this Owner
Home Financials are based on the most recent Mortgage that was taken out on this home.
Original Mortgage
$428,000
Outstanding Balance
$108,757
Interest Rate
6.84%
Estimated Equity
$2,195,677
Purchase Details
Closed on
May 1, 1996
Sold by
Clancy William J and Clancy Jane C
Bought by
Rinck Cyrus G and Rinck Lauran R
Home Financials for this Owner
Home Financials are based on the most recent Mortgage that was taken out on this home.
Original Mortgage
$320,000
Interest Rate
8%
Create a Home Valuation Report for This Property
The Home Valuation Report is an in-depth analysis detailing your home's value as well as a comparison with similar homes in the area
Home Values in the Area
Average Home Value in this Area
Purchase History
| Date | Buyer | Sale Price | Title Company |
|---|---|---|---|
| Martinez Jose | -- | -- | |
| Martinez Jose | -- | -- | |
| Martinez Jose | $595,000 | Santa Cruz Title Company | |
| Rinck Cyrus G | $400,000 | Old Republic Title Company | |
| Clancy William J | -- | Old Republic Title Company |
Source: Public Records
Mortgage History
| Date | Status | Borrower | Loan Amount |
|---|---|---|---|
| Open | Martinez Jose | $428,000 | |
| Previous Owner | Rinck Cyrus G | $320,000 |
Source: Public Records
Tax History Compared to Growth
Tax History
| Year | Tax Paid | Tax Assessment Tax Assessment Total Assessment is a certain percentage of the fair market value that is determined by local assessors to be the total taxable value of land and additions on the property. | Land | Improvement |
|---|---|---|---|---|
| 2025 | $11,317 | $939,177 | $533,029 | $406,148 |
| 2023 | $11,083 | $902,707 | $512,331 | $390,376 |
| 2022 | $10,844 | $885,008 | $502,286 | $382,722 |
| 2021 | $10,524 | $867,655 | $492,437 | $375,218 |
| 2020 | $10,349 | $858,757 | $487,387 | $371,370 |
| 2019 | $10,165 | $841,919 | $477,831 | $364,088 |
| 2018 | $9,892 | $825,411 | $468,462 | $356,949 |
| 2017 | $9,801 | $809,226 | $459,275 | $349,951 |
| 2016 | $9,557 | $793,359 | $450,270 | $343,089 |
| 2015 | $9,470 | $781,442 | $443,507 | $337,935 |
| 2014 | $9,250 | $766,134 | $434,819 | $331,315 |
Source: Public Records
Map
Nearby Homes
- 126 Via Novella
- 522 Seascape Resort Dr
- 2146 Penasquitas Dr
- 182 Hyannis Ct
- 452 Seascape Resort Dr
- 123 Seascape Resort Dr Unit 123
- 160 Seascape Ridge Dr
- 221 Seascape Resort Dr
- 117 Seascape Resort Dr
- 312 Seascape Resort Dr
- 315 Seascape Resort Dr
- 1540 Seascape Blvd Unit 2
- 302 Seascape Resort Dr
- 420 Camino al Mar
- 138 Farallon Ct
- 60 Seascape Resort Dr
- 29 Seascape Resort Dr
- 22 Seascape Resort Dr
- 1514 Dolphin Dr
- 1325 Dolphin Dr
- 110 Via Trinita
- 126 Via Trinita
- 134 Via Trinita
- 102 Via Trinita
- 117 Via Novella
- 125 Via Novella
- 109 Via Novella
- 133 Vía Novella
- 142 Via Trinita
- 133 Via Novella
- 101 Via Novella
- 109 Via Trinita
- 117 Via Trinita
- 141 Via Novella
- 150 Via Trinita
- 101 Via Trinita
- 125 Via Trinita
- 133 Via Trinita
- 149 Via Novella
- 158 Via Trinita