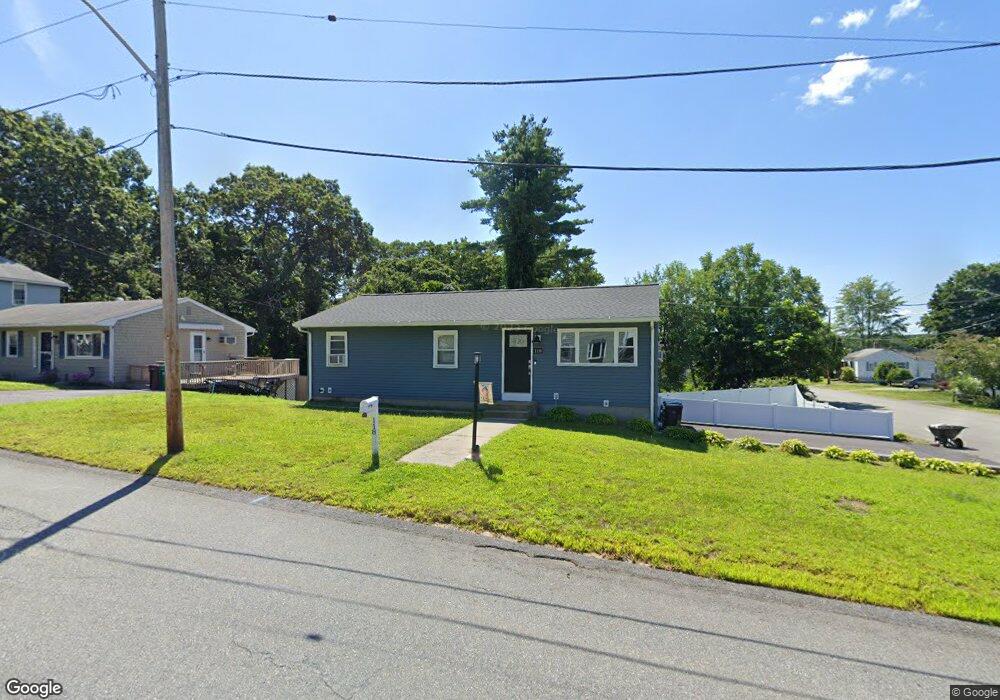
118 Vivian St Woonsocket, RI 02895
East Woonsocket NeighborhoodEstimated Value: $361,000 - $388,000
3
Beds
1
Bath
960
Sq Ft
$388/Sq Ft
Est. Value
About This Home
This home is located at 118 Vivian St, Woonsocket, RI 02895 and is currently estimated at $372,084, approximately $387 per square foot. 118 Vivian St is a home located in Providence County with nearby schools including Woonsocket High School, Blackstone Valley Prep Element, and Blackstone Valley Prep High School.
Ownership History
Date
Name
Owned For
Owner Type
Purchase Details
Closed on
Jul 27, 2018
Sold by
Lebrun Richard and Lebrun Christopher
Bought by
Lebrun Jeffrey R
Current Estimated Value
Home Financials for this Owner
Home Financials are based on the most recent Mortgage that was taken out on this home.
Original Mortgage
$75,000
Outstanding Balance
$65,008
Interest Rate
4.6%
Mortgage Type
New Conventional
Estimated Equity
$307,076
Purchase Details
Closed on
Oct 7, 2011
Sold by
Lebrun Aldea M
Bought by
Lebrun Roland R and Lebrun Richard R
Create a Home Valuation Report for This Property
The Home Valuation Report is an in-depth analysis detailing your home's value as well as a comparison with similar homes in the area
Home Values in the Area
Average Home Value in this Area
Purchase History
| Date | Buyer | Sale Price | Title Company |
|---|---|---|---|
| Lebrun Jeffrey R | $150,000 | -- | |
| Lebrun Roland R | -- | -- | |
| Lebrun Aldea | -- | -- | |
| Lebrun Jeffrey R | $150,000 | -- | |
| Lebrun Roland R | -- | -- |
Source: Public Records
Mortgage History
| Date | Status | Borrower | Loan Amount |
|---|---|---|---|
| Open | Lebrun Jeffrey R | $75,000 | |
| Closed | Lebrun Roland R | $75,000 |
Source: Public Records
Tax History Compared to Growth
Tax History
| Year | Tax Paid | Tax Assessment Tax Assessment Total Assessment is a certain percentage of the fair market value that is determined by local assessors to be the total taxable value of land and additions on the property. | Land | Improvement |
|---|---|---|---|---|
| 2025 | $4,098 | $364,900 | $105,300 | $259,600 |
| 2024 | $3,609 | $248,200 | $85,900 | $162,300 |
| 2023 | $3,470 | $248,200 | $85,900 | $162,300 |
| 2022 | $3,470 | $248,200 | $85,900 | $162,300 |
| 2021 | $3,995 | $168,200 | $67,600 | $100,600 |
| 2020 | $4,037 | $168,200 | $67,600 | $100,600 |
| 2018 | $4,050 | $168,200 | $67,600 | $100,600 |
| 2017 | $4,340 | $144,200 | $63,700 | $80,500 |
| 2016 | $4,591 | $144,200 | $63,700 | $80,500 |
| 2015 | $5,275 | $144,200 | $63,700 | $80,500 |
| 2014 | $5,373 | $149,500 | $70,100 | $79,400 |
Source: Public Records
Map
Nearby Homes