


118 W 87th Place Los Angeles, CA 90003
Broadway-Manchester NeighborhoodEstimated payment $4,963/month
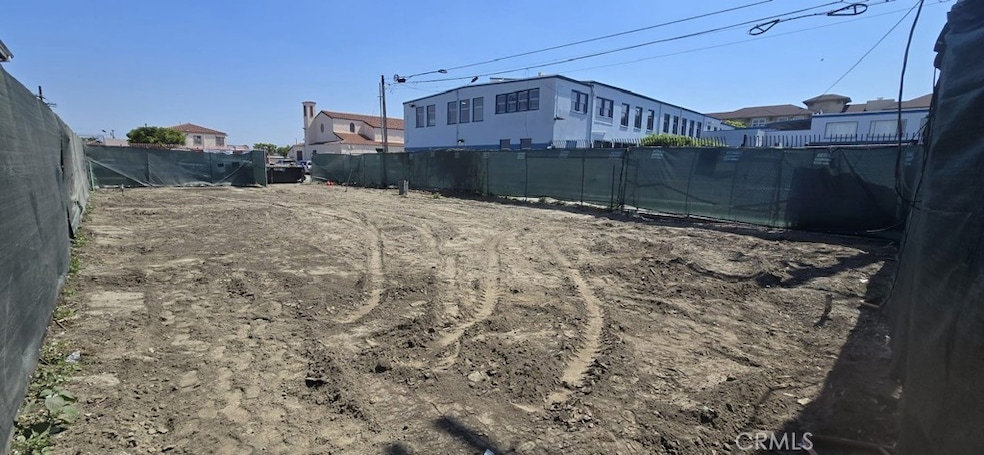
About This Lot
Fully RTI Section 8 Affordable Housing Development Project Located In South LA . 11 plus 1 Units. VACANT LAND READY TO BE BUILT ON Back Alley Access Way as well makes it even more convenient and accessible for construction. Proposed New Building Size 8226 SF on 5362 SF Lot Unit Mix (11) 1 Bedroom/1 Bathroom 3 Stories with ADA Approved Units ready for Section 8 No Parking Required Major cross streets 87th and Main St 90003 15 Minutes to USC and 25 to DTLA Walk Score of 73
Listing Agent
Keller Williams Luxury Brokerage Phone: 818-585-2758 License #01487871 Listed on: 06/17/2025

Property Details
Property Type
- Land
Est. Annual Taxes
- $7,316
Lot Details
- 8,226 Sq Ft Lot
- Property is zoned LAR3
Property Views
- Neighborhood Views
Community Details
- No Home Owners Association
Listing and Financial Details
- Tax Lot 43
- Tax Tract Number 337
- Assessor Parcel Number 6040021018
- $341 per year additional tax assessments
Map
Home Values in the Area
Average Home Value in this Area
Tax History
| Year | Tax Paid | Tax Assessment Tax Assessment Total Assessment is a certain percentage of the fair market value that is determined by local assessors to be the total taxable value of land and additions on the property. | Land | Improvement |
|---|---|---|---|---|
| 2025 | $7,316 | $593,028 | $416,160 | $176,868 |
| 2024 | $7,316 | $581,400 | $408,000 | $173,400 |
| 2023 | $7,178 | $570,000 | $400,000 | $170,000 |
| 2022 | $5,115 | $410,115 | $229,664 | $180,451 |
| 2021 | $5,049 | $402,074 | $225,161 | $176,913 |
| 2019 | $4,903 | $390,150 | $218,484 | $171,666 |
| 2018 | $4,841 | $382,500 | $214,200 | $168,300 |
| 2016 | $2,601 | $198,052 | $79,216 | $118,836 |
| 2015 | $2,566 | $195,078 | $78,027 | $117,051 |
| 2014 | $2,594 | $191,258 | $76,499 | $114,759 |
Property History
| Date | Event | Price | Change | Sq Ft Price |
|---|---|---|---|---|
| 06/17/2025 06/17/25 | For Sale | $805,000 | +41.2% | -- |
| 08/02/2022 08/02/22 | Sold | $570,000 | -1.6% | $381 / Sq Ft |
| 11/10/2021 11/10/21 | Price Changed | $579,000 | -3.3% | $387 / Sq Ft |
| 09/28/2021 09/28/21 | Price Changed | $599,000 | -4.9% | $400 / Sq Ft |
| 09/02/2021 09/02/21 | For Sale | $630,000 | -- | $421 / Sq Ft |
Purchase History
| Date | Type | Sale Price | Title Company |
|---|---|---|---|
| Quit Claim Deed | -- | Provident Title | |
| Grant Deed | -- | -- | |
| Grant Deed | $570,000 | Provident Title | |
| Deed | -- | Provident Title | |
| Quit Claim Deed | -- | Provident Title | |
| Grant Deed | -- | None Available |
Source: California Regional Multiple Listing Service (CRMLS)
MLS Number: SR25129029
APN: 6040-021-018
Disclaimer: Certain information contained herein is derived from information provided by parties other than Homes.com. All information provided is deemed reliable, but is not guaranteed to be accurate and should be independently verified.
![]() The multiple listing data appearing on this website, or contained in reports produced therefrom, is owned and copyrighted by California Regional Multiple Listing Service, Inc. ("CRMLS") and is protected by all applicable copyright laws. Information provided is for viewer's personal, non-commercial use and may not be used for any purpose other than to identify prospective properties the viewer may be interested in purchasing. All listing data, including but not limited to square footage and lot size is believed to be accurate, but the listing Agent, listing Broker and CRMLS and its affiliates do not warrant or guarantee such accuracy. The viewer should independently verify the listed data prior to making any decisions based on such information by personal inspection and/or contacting a real estate professional.
The multiple listing data appearing on this website, or contained in reports produced therefrom, is owned and copyrighted by California Regional Multiple Listing Service, Inc. ("CRMLS") and is protected by all applicable copyright laws. Information provided is for viewer's personal, non-commercial use and may not be used for any purpose other than to identify prospective properties the viewer may be interested in purchasing. All listing data, including but not limited to square footage and lot size is believed to be accurate, but the listing Agent, listing Broker and CRMLS and its affiliates do not warrant or guarantee such accuracy. The viewer should independently verify the listed data prior to making any decisions based on such information by personal inspection and/or contacting a real estate professional.
Based on information from California Regional Multiple Listing Service, Inc. and /or other sources. All data, including all measurements and calculations of area, is obtained from various sources and has not been, and will not be, verified by broker or MLS. All information should be independently reviewed and verified for accuracy. Properties may or may not be listed by the office/agent presenting the information
- 126 E 88th St
- 202 W 86th Place
- 231 W 88th St
- 146 E 88th St
- 126 E 89th St
- 146 E 89th St
- 142 W 85th St
- 214 E 85th St
- 328 W 88th Place
- 8418 S Main St
- 151 E 92nd St
- 9118 S Broadway
- 8504 S San Pedro St
- 214 W 92nd St
- 9004 S San Pedro St
- 212 W 84th St
- 8420 S Broadway
- 259 E 84th Place
- 122 E 83rd St
- 436 W 88th St
- 119 E 87th St Unit 2 bed 1.5 bath Duplex
- 8868 Wall St
- 8866 Wall St
- 8472 S Main St Unit 8476 1/2
- 208 W 90th St Unit 3
- 231 1/2 E 89th St
- 231 E 89th St
- 133 W 91st St
- 8765 S San Pedro St Unit Half
- 8703 S San Pedro St Unit 1/2
- 201 E 91st St
- 340 W 87th St Unit 1
- 340 W 87th St Unit 7
- 8418 S Main St
- 229 E 85th St Unit 231 12
- 236 W 84th Place
- 8510 San Pedro St
- 8508 1/4 San Pedro St
- 161 W 93rd St
- 342 W 91st Place