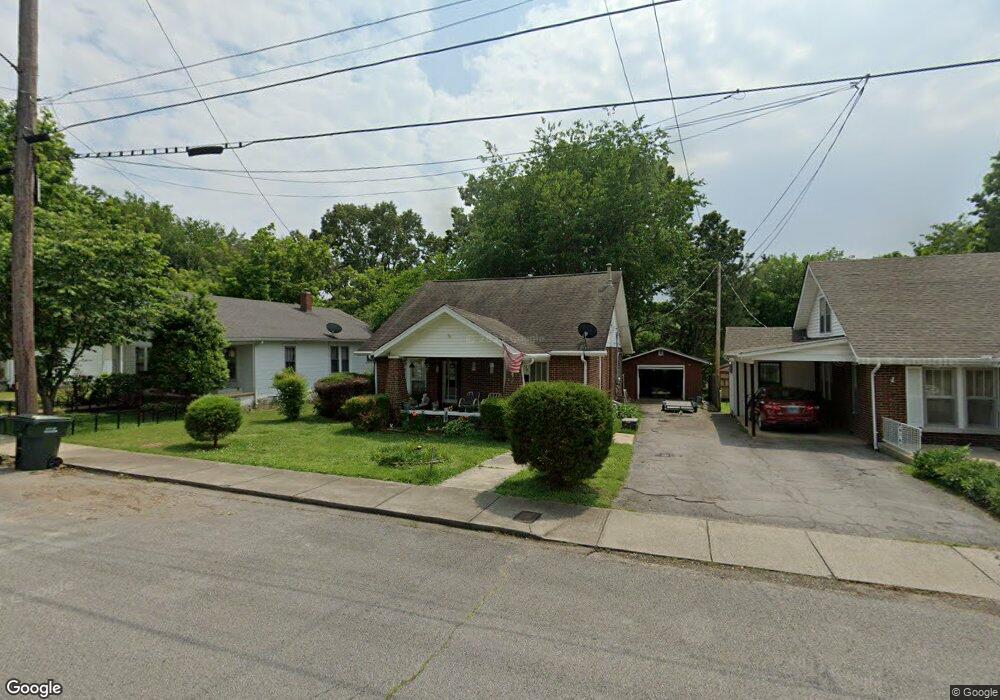
118 W End Ave Dickson, TN 37055
Estimated Value: $230,000 - $295,000
--
Bed
1
Bath
1,632
Sq Ft
$166/Sq Ft
Est. Value
About This Home
This home is located at 118 W End Ave, Dickson, TN 37055 and is currently estimated at $271,040, approximately $166 per square foot. 118 W End Ave is a home located in Dickson County with nearby schools including Dickson Elementary School, Dickson Middle School, and Dickson County High School.
Ownership History
Date
Name
Owned For
Owner Type
Purchase Details
Closed on
Apr 28, 2006
Sold by
Kimbro Keith A
Bought by
Steady Timothy
Current Estimated Value
Home Financials for this Owner
Home Financials are based on the most recent Mortgage that was taken out on this home.
Original Mortgage
$94,000
Outstanding Balance
$53,925
Interest Rate
6.33%
Estimated Equity
$217,115
Purchase Details
Closed on
Jan 30, 2002
Bought by
Kimbro Keith A and Kimbro Mary J
Purchase Details
Closed on
Sep 24, 1996
Sold by
Biggs Bobbie Anita
Bought by
Wright Keely
Purchase Details
Closed on
Feb 8, 1995
Sold by
Revis William J
Bought by
Biggs Bobbie A
Purchase Details
Closed on
Oct 20, 1988
Bought by
Revis William J
Purchase Details
Closed on
May 25, 1988
Bought by
Myatt Benjamin F and Myatt Sandra D
Purchase Details
Closed on
Nov 6, 1985
Bought by
Hobbs Joe R
Create a Home Valuation Report for This Property
The Home Valuation Report is an in-depth analysis detailing your home's value as well as a comparison with similar homes in the area
Home Values in the Area
Average Home Value in this Area
Purchase History
| Date | Buyer | Sale Price | Title Company |
|---|---|---|---|
| Steady Timothy | $94,500 | -- | |
| Kimbro Keith A | $73,000 | -- | |
| Wright Keely | $68,000 | -- | |
| Biggs Bobbie A | $59,500 | -- | |
| Revis William J | -- | -- | |
| Myatt Benjamin F | -- | -- | |
| Hobbs Joe R | -- | -- |
Source: Public Records
Mortgage History
| Date | Status | Borrower | Loan Amount |
|---|---|---|---|
| Open | Hobbs Joe R | $94,000 |
Source: Public Records
Tax History Compared to Growth
Tax History
| Year | Tax Paid | Tax Assessment Tax Assessment Total Assessment is a certain percentage of the fair market value that is determined by local assessors to be the total taxable value of land and additions on the property. | Land | Improvement |
|---|---|---|---|---|
| 2025 | -- | $54,375 | $0 | $0 |
| 2024 | $1,171 | $54,375 | $11,200 | $43,175 |
| 2023 | $1,171 | $37,475 | $5,875 | $31,600 |
| 2022 | $1,171 | $37,475 | $5,875 | $31,600 |
| 2021 | $1,171 | $37,475 | $5,875 | $31,600 |
| 2020 | $1,171 | $37,475 | $5,875 | $31,600 |
| 2019 | $1,171 | $37,475 | $5,875 | $31,600 |
| 2018 | $950 | $26,050 | $4,750 | $21,300 |
| 2017 | $950 | $26,050 | $4,750 | $21,300 |
| 2016 | $950 | $26,050 | $4,750 | $21,300 |
| 2015 | $877 | $22,600 | $4,750 | $17,850 |
| 2014 | $877 | $22,600 | $4,750 | $17,850 |
Source: Public Records
Map
Nearby Homes
- 414 W College St
- 701 W 5th St
- 805 W 2nd St
- 119 Oak Dr
- 213 Mccreary Heights
- 110 Mccreary Heights
- 303 W College St
- 909 W 1st St
- 0 Hardin Ave
- 205 Oak Dr
- 210 Hardin Ave
- 0 Rocky Dr Unit RTC2761527
- 0 W Walnut St
- 0 Tucker Rd Unit RTC3051077
- 129 Ironhorse Way
- 0 W First St
- 122 Pond Rd
- 108 Poplar St
- 500 Church St
- 500 Country Club Dr