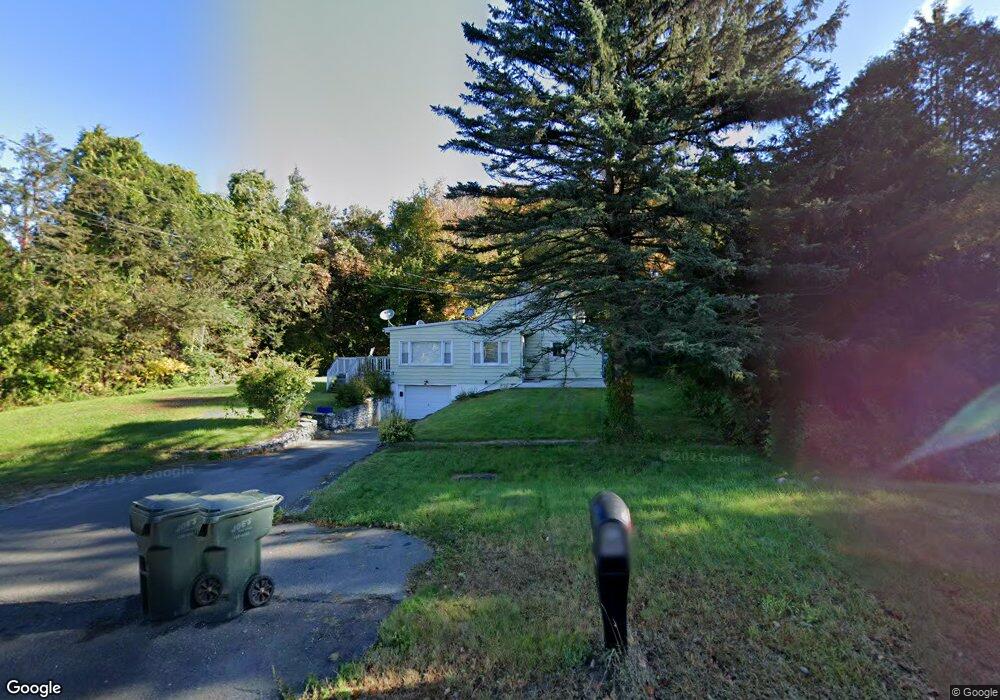
118 Waterbury Rd Prospect, CT 06712
Estimated Value: $373,000 - $426,000
3
Beds
1
Bath
1,569
Sq Ft
$262/Sq Ft
Est. Value
About This Home
This home is located at 118 Waterbury Rd, Prospect, CT 06712 and is currently estimated at $411,001, approximately $261 per square foot. 118 Waterbury Rd is a home located in New Haven County with nearby schools including Prospect Elementary School, Long River Middle School, and Woodland Regional High School.
Ownership History
Date
Name
Owned For
Owner Type
Purchase Details
Closed on
Jun 9, 2023
Sold by
Scampolino Francis J and Scampolino Carrie M
Bought by
Scampolino Lt and Scampolino
Current Estimated Value
Purchase Details
Closed on
Mar 19, 2009
Sold by
Hsbc Bank Usa
Bought by
Scampolino Francis J and Scampolino Carrie M
Purchase Details
Closed on
Feb 22, 2007
Sold by
118 Robinson Ft Usa and Hawthorn
Bought by
Nguyen Crystal T
Home Financials for this Owner
Home Financials are based on the most recent Mortgage that was taken out on this home.
Original Mortgage
$164,000
Interest Rate
6.23%
Mortgage Type
Purchase Money Mortgage
Purchase Details
Closed on
Nov 17, 2006
Sold by
Robinson Glen A and Robinson Nancy E
Bought by
Hawthorn William
Purchase Details
Closed on
Aug 23, 1999
Sold by
Brooks Joseph E and Brooks Mary S
Bought by
Robinson Glen A and Robinson Nancy E
Create a Home Valuation Report for This Property
The Home Valuation Report is an in-depth analysis detailing your home's value as well as a comparison with similar homes in the area
Home Values in the Area
Average Home Value in this Area
Purchase History
| Date | Buyer | Sale Price | Title Company |
|---|---|---|---|
| Scampolino Lt | -- | None Available | |
| Scampolino Francis J | $110,000 | -- | |
| Wells Fargo Bk | -- | -- | |
| Nguyen Crystal T | $205,000 | -- | |
| Hawthorn William | $150,000 | -- | |
| Robinson Glen A | $91,200 | -- |
Source: Public Records
Mortgage History
| Date | Status | Borrower | Loan Amount |
|---|---|---|---|
| Previous Owner | Robinson Glen A | $164,000 | |
| Previous Owner | Robinson Glen A | $41,000 | |
| Previous Owner | Robinson Glen A | $150,500 |
Source: Public Records
Tax History Compared to Growth
Tax History
| Year | Tax Paid | Tax Assessment Tax Assessment Total Assessment is a certain percentage of the fair market value that is determined by local assessors to be the total taxable value of land and additions on the property. | Land | Improvement |
|---|---|---|---|---|
| 2025 | $5,622 | $219,870 | $59,570 | $160,300 |
| 2024 | $4,831 | $150,300 | $59,600 | $90,700 |
| 2023 | $4,136 | $129,560 | $59,600 | $69,960 |
| 2022 | $4,139 | $129,560 | $59,600 | $69,960 |
| 2021 | $4,185 | $129,560 | $59,600 | $69,960 |
| 2020 | $3,915 | $123,900 | $59,600 | $64,300 |
| 2019 | $3,835 | $123,900 | $59,600 | $64,300 |
| 2018 | $3,841 | $123,900 | $59,600 | $64,300 |
| 2017 | $3,872 | $123,900 | $59,600 | $64,300 |
| 2016 | $3,706 | $123,900 | $59,600 | $64,300 |
| 2015 | $3,585 | $122,650 | $59,600 | $63,050 |
| 2014 | $3,554 | $122,650 | $59,600 | $63,050 |
Source: Public Records
Map
Nearby Homes