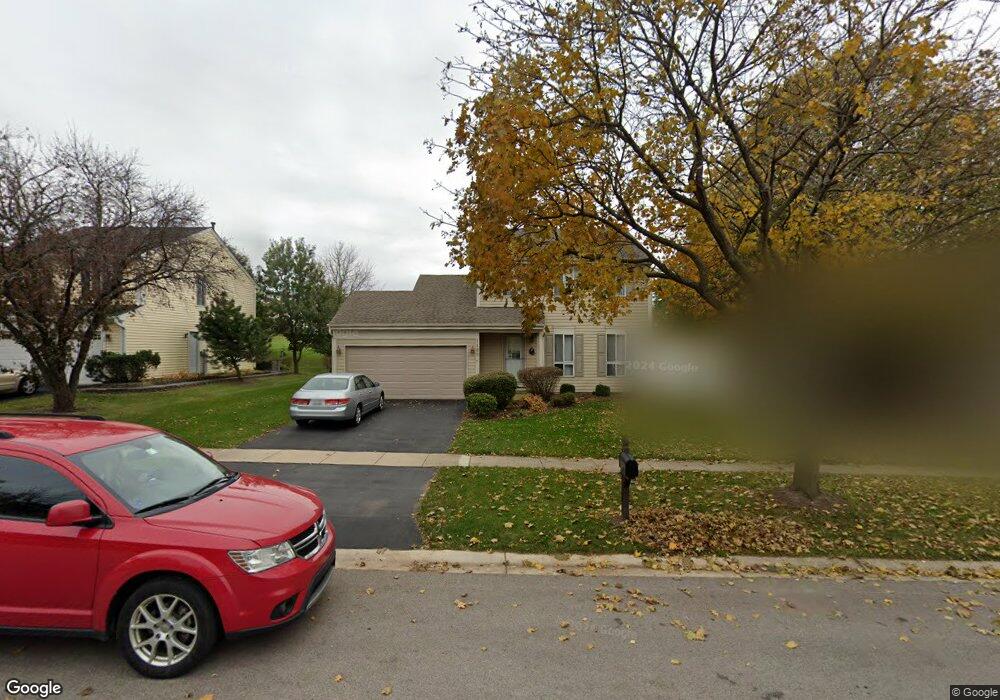
1180 Appleton Ln Geneva, IL 60134
Northeast Central Geneva NeighborhoodEstimated Value: $387,000 - $420,000
3
Beds
2
Baths
1,580
Sq Ft
$253/Sq Ft
Est. Value
About This Home
This home is located at 1180 Appleton Ln, Geneva, IL 60134 and is currently estimated at $399,011, approximately $252 per square foot. 1180 Appleton Ln is a home located in Kane County with nearby schools including Harrison Street Elementary School, Geneva Community High School, and Kensington School of St Charles.
Ownership History
Date
Name
Owned For
Owner Type
Purchase Details
Closed on
Jul 15, 2004
Sold by
Drendel Carol J and Drendel Brian R
Bought by
Cichorski Jeannine A
Current Estimated Value
Home Financials for this Owner
Home Financials are based on the most recent Mortgage that was taken out on this home.
Original Mortgage
$170,000
Outstanding Balance
$85,762
Interest Rate
6.37%
Mortgage Type
Balloon
Estimated Equity
$313,249
Purchase Details
Closed on
Jun 18, 1999
Sold by
Bartholomew Jonathan and Bartholomew Shari
Bought by
Seyller Carol J
Home Financials for this Owner
Home Financials are based on the most recent Mortgage that was taken out on this home.
Original Mortgage
$150,300
Interest Rate
7.69%
Create a Home Valuation Report for This Property
The Home Valuation Report is an in-depth analysis detailing your home's value as well as a comparison with similar homes in the area
Home Values in the Area
Average Home Value in this Area
Purchase History
| Date | Buyer | Sale Price | Title Company |
|---|---|---|---|
| Cichorski Jeannine A | $227,500 | Chicago Title Insurance Comp | |
| Seyller Carol J | $170,500 | Chicago Title Insurance Co |
Source: Public Records
Mortgage History
| Date | Status | Borrower | Loan Amount |
|---|---|---|---|
| Open | Cichorski Jeannine A | $170,000 | |
| Previous Owner | Seyller Carol J | $150,300 |
Source: Public Records
Tax History
| Year | Tax Paid | Tax Assessment Tax Assessment Total Assessment is a certain percentage of the fair market value that is determined by local assessors to be the total taxable value of land and additions on the property. | Land | Improvement |
|---|---|---|---|---|
| 2024 | $7,650 | $107,371 | $25,893 | $81,478 |
| 2023 | $7,398 | $97,610 | $23,539 | $74,071 |
| 2022 | $7,118 | $90,698 | $21,872 | $68,826 |
| 2021 | $6,903 | $87,327 | $21,059 | $66,268 |
| 2020 | $6,820 | $85,995 | $20,738 | $65,257 |
| 2019 | $6,799 | $84,366 | $20,345 | $64,021 |
| 2018 | $6,244 | $78,068 | $20,345 | $57,723 |
| 2017 | $5,790 | $71,651 | $19,802 | $51,849 |
| 2016 | $5,552 | $67,718 | $19,534 | $48,184 |
| 2015 | -- | $64,383 | $18,572 | $45,811 |
| 2014 | -- | $71,641 | $18,572 | $53,069 |
| 2013 | -- | $71,641 | $18,572 | $53,069 |
Source: Public Records
Map
Nearby Homes
- 642 Nichole Ln
- 1326 Windsor Ct
- 000 Averill Cir
- 111 Aberdeen Ct
- 501 Elm Ave
- 122 Aberdeen Ct
- 142 Aberdeen Ct
- 404 Woodward Ave
- 1121 Independence Ave
- 130 Division St
- 111 Ridge Ln
- 202 N Bennett St
- 10 Ford St Unit 306
- 1186 Willowgate Ln
- 15 White Oak Cir
- 1501 Dempsey Dr
- 119 N 1st St
- 722 S 9th Ave
- 31 Roosevelt St
- 228 Crissey Ave
- 1190 Appleton Ln
- 1170 Appleton Ln
- 1145 Westfield Course
- 1160 Appleton Ln
- 1200 Appleton Ln
- 1143 Westfield Course
- 1175 Appleton Ln
- 1147 Westfield Course
- 1185 Appleton Ln
- 1165 Appleton Ln
- 1225 Appleton Ln
- 1150 Appleton Ln
- 1155 Appleton Ln
- 1210 Appleton Ln
- 1141 Westfield Course
- 1149 Westfield Course
- 1145 Appleton Ln
- 1139 Westfield Course
- 1140 Appleton Ln
- 1235 Appleton Ln
Your Personal Tour Guide
Ask me questions while you tour the home.