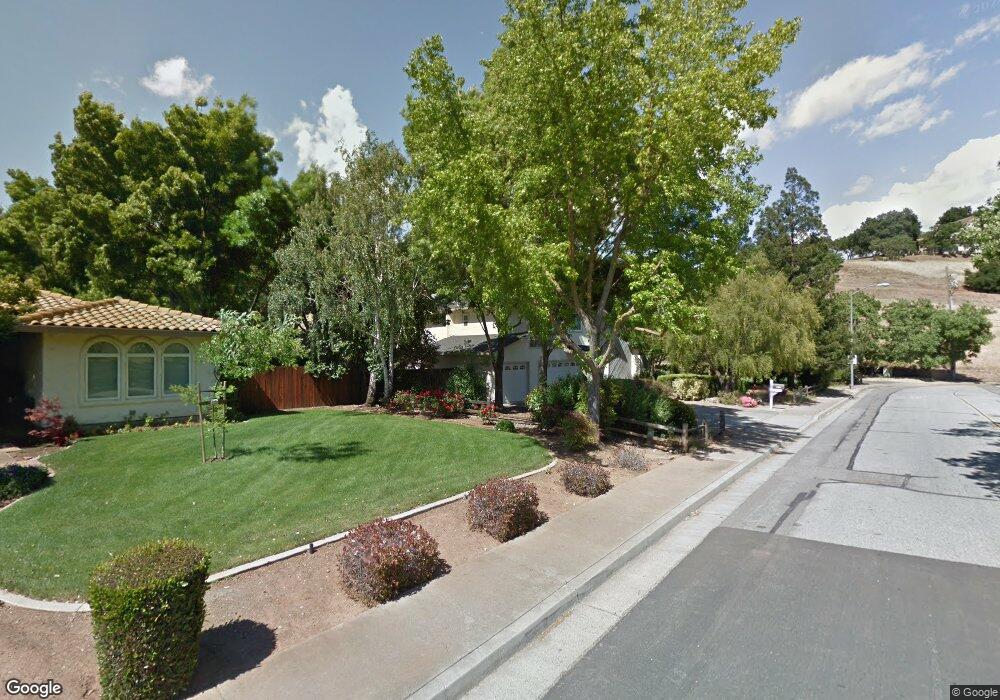
1180 Easy St Morgan Hill, CA 95037
Estimated Value: $1,429,000 - $1,709,000
6
Beds
4
Baths
2,343
Sq Ft
$663/Sq Ft
Est. Value
About This Home
This home is located at 1180 Easy St, Morgan Hill, CA 95037 and is currently estimated at $1,552,508, approximately $662 per square foot. 1180 Easy St is a home located in Santa Clara County with nearby schools including San Martin/Gwinn Environmental Science Academy, Britton Middle School, and Ann Sobrato High School.
Ownership History
Date
Name
Owned For
Owner Type
Purchase Details
Closed on
Nov 13, 2019
Sold by
Yang Yining and Sun Dongmei
Bought by
Sun Development Llc
Current Estimated Value
Purchase Details
Closed on
May 16, 2017
Sold by
Yang Yining and Sun Dongmei
Bought by
The Yang Family Revocable Living Trust and Yang Yining
Purchase Details
Closed on
May 26, 2016
Sold by
Yang Yining and Sun Dongmei
Bought by
Yang Yining and Sun Dongmei
Purchase Details
Closed on
Dec 18, 2012
Sold by
Yang Yining and Sun Dongmei
Bought by
Yang Yining and Sun Dongmei
Purchase Details
Closed on
Oct 21, 2003
Sold by
Dillon Ralph J and Dillon Susan L
Bought by
Yang Yining and Sun Dongmei
Home Financials for this Owner
Home Financials are based on the most recent Mortgage that was taken out on this home.
Original Mortgage
$574,400
Outstanding Balance
$263,074
Interest Rate
5.94%
Mortgage Type
Purchase Money Mortgage
Estimated Equity
$1,289,434
Create a Home Valuation Report for This Property
The Home Valuation Report is an in-depth analysis detailing your home's value as well as a comparison with similar homes in the area
Home Values in the Area
Average Home Value in this Area
Purchase History
| Date | Buyer | Sale Price | Title Company |
|---|---|---|---|
| Sun Development Llc | -- | None Available | |
| The Yang Family Revocable Living Trust | -- | None Available | |
| Yang Yining | -- | None Available | |
| Yang Yining | -- | None Available | |
| Yang Yining | $718,000 | Chicago Title |
Source: Public Records
Mortgage History
| Date | Status | Borrower | Loan Amount |
|---|---|---|---|
| Open | Yang Yining | $574,400 |
Source: Public Records
Tax History Compared to Growth
Tax History
| Year | Tax Paid | Tax Assessment Tax Assessment Total Assessment is a certain percentage of the fair market value that is determined by local assessors to be the total taxable value of land and additions on the property. | Land | Improvement |
|---|---|---|---|---|
| 2025 | $12,907 | $1,148,320 | $612,502 | $535,818 |
| 2024 | $12,907 | $1,125,805 | $600,493 | $525,312 |
| 2023 | $12,741 | $1,103,731 | $588,719 | $515,012 |
| 2022 | $12,529 | $1,082,090 | $577,176 | $504,914 |
| 2021 | $12,215 | $1,060,873 | $565,859 | $495,014 |
| 2020 | $11,919 | $1,049,996 | $560,057 | $489,939 |
| 2019 | $12,177 | $1,029,409 | $549,076 | $480,333 |
| 2018 | $12,214 | $1,009,225 | $538,310 | $470,915 |
| 2017 | $12,098 | $989,437 | $527,755 | $461,682 |
| 2016 | $11,332 | $970,037 | $517,407 | $452,630 |
| 2015 | $10,330 | $880,000 | $439,800 | $440,200 |
| 2014 | $10,166 | $836,500 | $418,100 | $418,400 |
Source: Public Records
Map
Nearby Homes
- 42 Dewey Cir
- 56 Creekside Dr Unit 56
- 92 Melody Ln Unit 92
- 97 Melody Ln Unit 97
- 136 Vinewood Ln Unit 136
- 199 Leisure Dr Unit 199
- 14325 Monterey Rd
- 1935 Hayes Ln
- 14430 Monterey Hwy
- 15120 Venetian Way
- 15180 Venetian Way
- 542 Via Sorrento
- 15145 Bellini Way
- 0 Llagas Ave Unit ML82019140
- 12645 Harding Ave
- 30 Chester Ave
- 0 W San Martin Ave
- 0 Seymour Ave Unit 225017465
- 475 E Middle Ave
- 605 Encino Dr