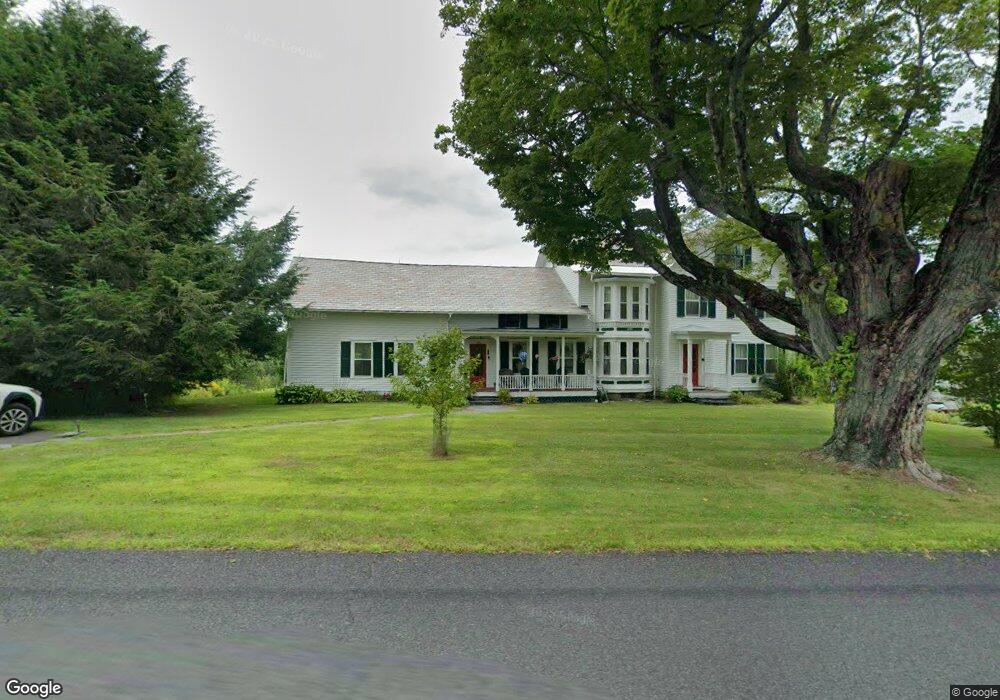
1180 Hawley Rd Ashfield, MA 01330
Ashfield NeighborhoodEstimated Value: $500,000 - $762,000
4
Beds
2
Baths
2,406
Sq Ft
$253/Sq Ft
Est. Value
About This Home
This home is located at 1180 Hawley Rd, Ashfield, MA 01330 and is currently estimated at $609,849, approximately $253 per square foot. 1180 Hawley Rd is a home located in Franklin County with nearby schools including Mohawk Trail Regional High School.
Ownership History
Date
Name
Owned For
Owner Type
Purchase Details
Closed on
Apr 22, 2011
Sold by
Wall Brian K and King Linda M
Bought by
Cherdack Robert
Current Estimated Value
Purchase Details
Closed on
Aug 27, 2007
Sold by
Thompson Jeanne L
Bought by
Wall Brian K
Home Financials for this Owner
Home Financials are based on the most recent Mortgage that was taken out on this home.
Original Mortgage
$380,000
Interest Rate
6.78%
Mortgage Type
Purchase Money Mortgage
Purchase Details
Closed on
Jul 22, 1994
Sold by
Conrad Irt
Bought by
Thompson Jeanne L
Home Financials for this Owner
Home Financials are based on the most recent Mortgage that was taken out on this home.
Original Mortgage
$80,000
Interest Rate
8.19%
Mortgage Type
Purchase Money Mortgage
Create a Home Valuation Report for This Property
The Home Valuation Report is an in-depth analysis detailing your home's value as well as a comparison with similar homes in the area
Home Values in the Area
Average Home Value in this Area
Purchase History
| Date | Buyer | Sale Price | Title Company |
|---|---|---|---|
| Cherdack Robert | $315,000 | -- | |
| Wall Brian K | $529,000 | -- | |
| Thompson Jeanne L | $195,000 | -- |
Source: Public Records
Mortgage History
| Date | Status | Borrower | Loan Amount |
|---|---|---|---|
| Previous Owner | Wall Brian K | $380,000 | |
| Previous Owner | Thompson Jeanne L | $75,900 | |
| Previous Owner | Thompson Jeanne L | $195,000 | |
| Previous Owner | Thompson Jeanne L | $111,000 | |
| Previous Owner | Thompson Jeanne L | $80,000 |
Source: Public Records
Tax History Compared to Growth
Tax History
| Year | Tax Paid | Tax Assessment Tax Assessment Total Assessment is a certain percentage of the fair market value that is determined by local assessors to be the total taxable value of land and additions on the property. | Land | Improvement |
|---|---|---|---|---|
| 2025 | $6,352 | $471,900 | $116,000 | $355,900 |
| 2024 | $6,554 | $448,600 | $116,000 | $332,600 |
| 2023 | $6,176 | $350,700 | $93,400 | $257,300 |
| 2022 | $5,793 | $333,300 | $89,100 | $244,200 |
| 2021 | $5,372 | $324,600 | $89,100 | $235,500 |
| 2020 | $5,408 | $324,600 | $89,100 | $235,500 |
| 2019 | $5,426 | $316,200 | $90,500 | $225,700 |
| 2018 | $5,357 | $311,800 | $90,500 | $221,300 |
| 2017 | $5,040 | $310,700 | $89,400 | $221,300 |
| 2016 | $4,820 | $293,200 | $89,400 | $203,800 |
| 2015 | $4,682 | $293,200 | $89,400 | $203,800 |
| 2014 | $4,745 | $293,600 | $83,200 | $210,400 |
Source: Public Records
Map
Nearby Homes
- 220 Hawley Rd
- 0 Old Stage Rd Unit 73326639
- 0 Ashfield Rd
- 81 Smith Rd
- 4 Plainfield Rd
- 374 Watson Spruce Corner Rd
- 292 E Hawley Rd
- 0 Upper St
- 240 Beldingville Rd
- 156 Ashfield Rd
- 153 E Hawley Rd
- Lot 3.2 East Rd
- 0, Lot 7 East Rd
- 0 John Ford Rd Unit 73403156
- 0 John Ford Rd Unit 73403157
- 124 E Hawley Rd
- 143 Charlemont Rd
- 41 Hog Hollow Rd
- 2129 Route 2
- 0 S River Rd
- 1209 Hawley Rd
- 1147 Hawley Rd
- 1169 Apple Valley Rd
- 37 Tatro Rd
- 1244 Hawley Rd
- 1261 Hawley Rd
- 98 Tatro Rd
- 1086 Hawley Rd
- 1079 Hawley Rd
- 1057 Hawley Rd
- 1280 Hawley Rd
- 1333 Hawley Rd
- 1038 Hawley Rd
- 1035 Hawley Rd
- 125 Tatro Rd
- 1024 Hawley Rd
- 131 Tatro Rd
- 1023 Hawley Rd
- 1023 Hawley Rd
- 1003 Apple Valley Rd