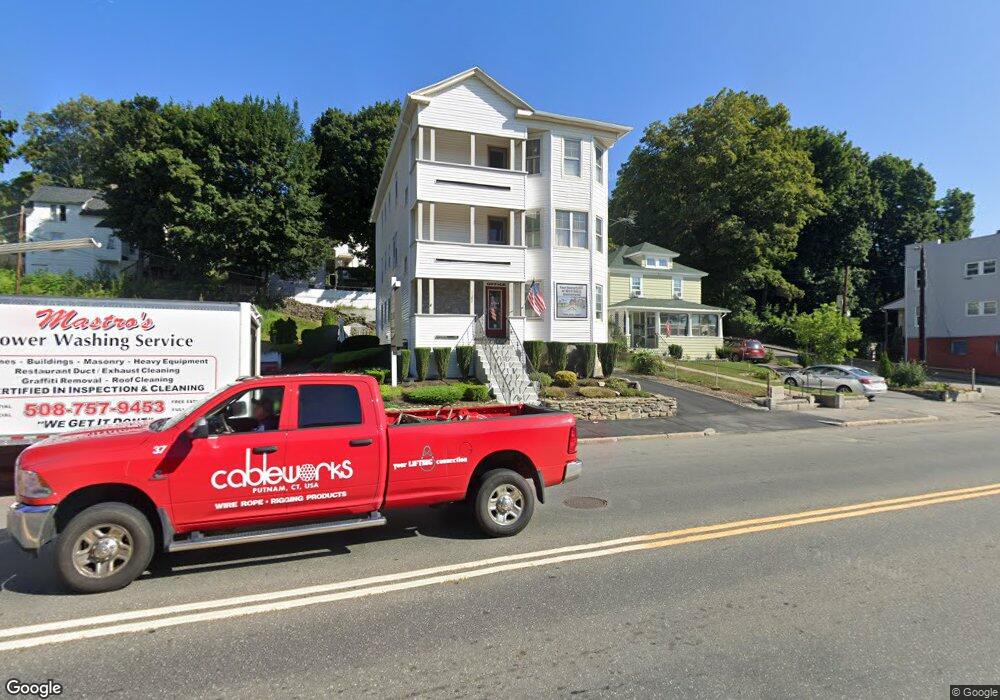
1180 Main St Worcester, MA 01603
Webster Square NeighborhoodEstimated Value: $714,000 - $796,000
9
Beds
3
Baths
4,017
Sq Ft
$185/Sq Ft
Est. Value
About This Home
This home is located at 1180 Main St, Worcester, MA 01603 and is currently estimated at $741,667, approximately $184 per square foot. 1180 Main St is a home located in Worcester County with nearby schools including Gates Lane, Jacob Hiatt Magnet School, and Chandler Magnet.
Ownership History
Date
Name
Owned For
Owner Type
Purchase Details
Closed on
Jul 30, 2014
Sold by
Barsamian Gloria J and Barsamian Judith
Bought by
Barsamian Gloria J and Abbascia Joseph
Current Estimated Value
Create a Home Valuation Report for This Property
The Home Valuation Report is an in-depth analysis detailing your home's value as well as a comparison with similar homes in the area
Home Values in the Area
Average Home Value in this Area
Purchase History
| Date | Buyer | Sale Price | Title Company |
|---|---|---|---|
| Barsamian Gloria J | -- | -- |
Source: Public Records
Tax History
| Year | Tax Paid | Tax Assessment Tax Assessment Total Assessment is a certain percentage of the fair market value that is determined by local assessors to be the total taxable value of land and additions on the property. | Land | Improvement |
|---|---|---|---|---|
| 2025 | $9,546 | $723,700 | $85,900 | $637,800 |
| 2024 | $8,763 | $637,300 | $85,900 | $551,400 |
| 2023 | $8,409 | $586,400 | $74,700 | $511,700 |
| 2022 | $7,322 | $481,400 | $59,800 | $421,600 |
| 2021 | $6,504 | $399,500 | $47,800 | $351,700 |
| 2020 | $4,405 | $259,100 | $47,500 | $211,600 |
| 2019 | $4,387 | $243,700 | $41,500 | $202,200 |
| 2018 | $4,289 | $226,800 | $41,500 | $185,300 |
| 2017 | $4,023 | $209,300 | $41,500 | $167,800 |
| 2016 | $3,838 | $186,200 | $30,300 | $155,900 |
| 2015 | $3,737 | $186,200 | $30,300 | $155,900 |
| 2014 | $3,638 | $186,200 | $30,300 | $155,900 |
Source: Public Records
Map
Nearby Homes
- 2 Montague St
- 23 Lakewood St
- 27 Montague St
- 37 Gates Rd
- 31 B Gates Rd Unit 22R
- 26 Sylvan St
- 10 Lucian St
- 5 Stoneland Rd
- 12 Stoneland Rd
- 215 Mill St Unit 113
- 215 Mill St Unit 115
- 103 Henshaw St
- 152 Beaverbrook Pkwy
- 19 Woodbine St
- 15 Circuit Ave E
- 55 Grandview Ave
- 11 Hulbert Rd Unit 13
- 5 Freeland Terrace
- 19 Oliver St
- 56 Richards St
- 1180 Main St Unit 3
- 1178 Main St
- 1 Wayne Terrace
- 1 Wayne St
- 1192 Main St
- 3 Wayne Terrace
- 1170 Main St
- 4 Wayne Terrace
- 6 Wayne Terrace
- 6 Wayne Terrace Unit 2
- 2 Montague St Unit 3
- 2 Montague St Unit 1
- 4 Wayne St
- 1194 Main St
- 1168 Main St
- 1168 Main St Unit 2
- 6 Wayne St
- 9 Wayne St
- 6 Montague St
- 4 Montague St
Your Personal Tour Guide
Ask me questions while you tour the home.