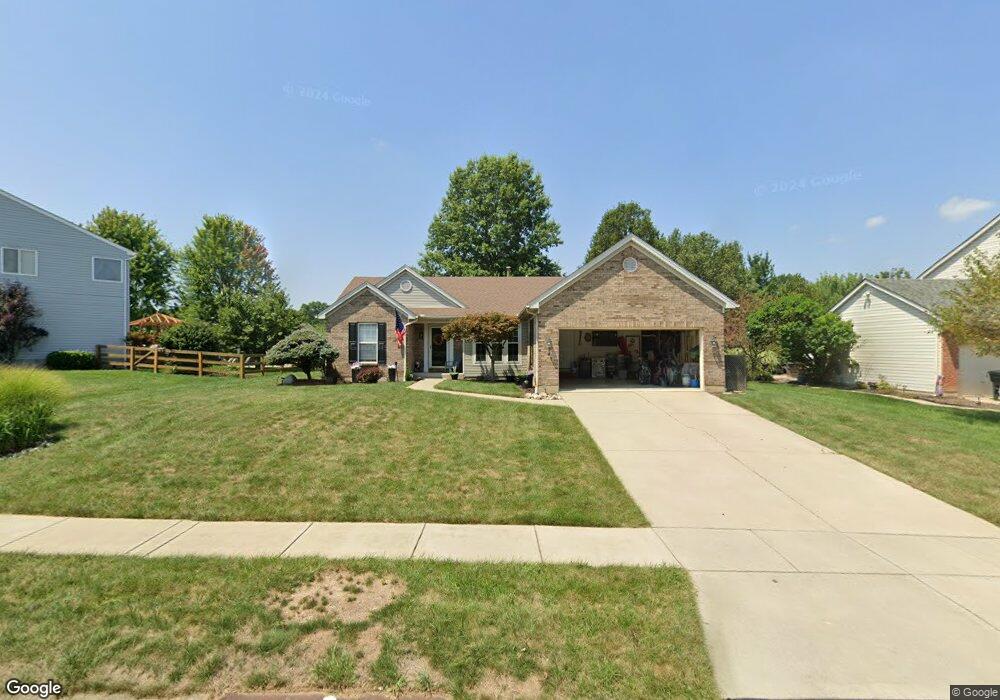
1180 Parkside Dr Batavia, OH 45103
Estimated Value: $317,748 - $343,000
3
Beds
2
Baths
1,452
Sq Ft
$229/Sq Ft
Est. Value
About This Home
This home is located at 1180 Parkside Dr, Batavia, OH 45103 and is currently estimated at $333,187, approximately $229 per square foot. 1180 Parkside Dr is a home located in Clermont County with nearby schools including Batavia Elementary School, Batavia Middle School, and Batavia High School.
Ownership History
Date
Name
Owned For
Owner Type
Purchase Details
Closed on
Oct 16, 2006
Sold by
Koning Craig T and Koning Joy K
Bought by
Buczak Benjamin
Current Estimated Value
Home Financials for this Owner
Home Financials are based on the most recent Mortgage that was taken out on this home.
Original Mortgage
$196,050
Outstanding Balance
$117,245
Interest Rate
6.5%
Mortgage Type
Purchase Money Mortgage
Estimated Equity
$215,942
Purchase Details
Closed on
Aug 4, 1999
Sold by
Buckhead Homes Inc
Bought by
Koning Craig T
Home Financials for this Owner
Home Financials are based on the most recent Mortgage that was taken out on this home.
Original Mortgage
$140,150
Interest Rate
7.68%
Mortgage Type
New Conventional
Purchase Details
Closed on
Mar 8, 1999
Sold by
Drees Co
Bought by
Buckhead Homes Inc
Create a Home Valuation Report for This Property
The Home Valuation Report is an in-depth analysis detailing your home's value as well as a comparison with similar homes in the area
Home Values in the Area
Average Home Value in this Area
Purchase History
| Date | Buyer | Sale Price | Title Company |
|---|---|---|---|
| Buczak Benjamin | $196,100 | Attorney | |
| Koning Craig T | $147,558 | -- | |
| Buckhead Homes Inc | $58,000 | -- |
Source: Public Records
Mortgage History
| Date | Status | Borrower | Loan Amount |
|---|---|---|---|
| Open | Buczak Benjamin | $196,050 | |
| Previous Owner | Koning Craig T | $140,150 |
Source: Public Records
Tax History Compared to Growth
Tax History
| Year | Tax Paid | Tax Assessment Tax Assessment Total Assessment is a certain percentage of the fair market value that is determined by local assessors to be the total taxable value of land and additions on the property. | Land | Improvement |
|---|---|---|---|---|
| 2024 | $3,438 | $84,280 | $19,460 | $64,820 |
| 2023 | $3,439 | $84,280 | $19,460 | $64,820 |
| 2022 | $3,426 | $62,060 | $14,350 | $47,710 |
| 2021 | $3,451 | $62,060 | $14,350 | $47,710 |
| 2020 | $3,464 | $62,060 | $14,350 | $47,710 |
| 2019 | $2,997 | $53,630 | $14,250 | $39,380 |
| 2018 | $3,096 | $53,630 | $14,250 | $39,380 |
| 2017 | $2,759 | $53,630 | $14,250 | $39,380 |
| 2016 | $2,759 | $49,810 | $12,600 | $37,210 |
| 2015 | $2,674 | $49,810 | $12,600 | $37,210 |
| 2014 | $2,674 | $49,810 | $12,600 | $37,210 |
| 2013 | $3,153 | $57,510 | $12,250 | $45,260 |
Source: Public Records
Map
Nearby Homes
- 1161 Creekstone Dr
- 1195 Shayler Woods Dr
- 1184 Creekstone Dr
- 4141 Woodsly Dr
- 1194 Meadow Knoll Ct
- 4169 Sagewood Ct
- 4146 Sagewood Ct
- 4239 Pheasant Hollow
- 1204 Cedar Run Ct
- Wesley Plan at Silverstone - Maple Street Collection
- Jensen Plan at Buxton Oaks - Maple Street Collection
- Fairfax Plan at Silverstone - Maple Street Collection
- Danville Plan at Buxton Oaks - Maple Street Collection
- Cumberland Plan at Silverstone - Maple Street Collection
- Breckenridge Plan at Buxton Oaks - Maple Street Collection
- Wesley Plan at Buxton Oaks - Maple Street Collection
- Breckenridge Plan at Silverstone - Maple Street Collection
- Beacon Plan at Buxton Oaks - Maple Street Collection
- Jensen Plan at Silverstone - Maple Street Collection
- Roseville Plan at Silverstone - Maple Street Collection
- 1182 Parkside Dr
- 1174 Sparrowwood Blvd
- 1177 Wingwood Trail
- 1179 Wingwood Trail
- 1184 Parkside Dr
- 1173 Wingwood Trail
- 1181 Wingwood Trail
- 1177 Parkside Dr
- 1186 Parkside Dr
- 1173 Sparrowwood Blvd
- 1183 Wingwood Trail
- 1171 Sparrowwood Blvd
- 1188 Parkside Dr
- 1164 Sparrowwood Blvd
- 1178 Wingwood Trail
- 1169 Sparrowwood Blvd
- 1185 Wingwood Trail
- 1172 Parkside Dr
- 1186 Woodchase Trail
- 1182 Wingwood Trail