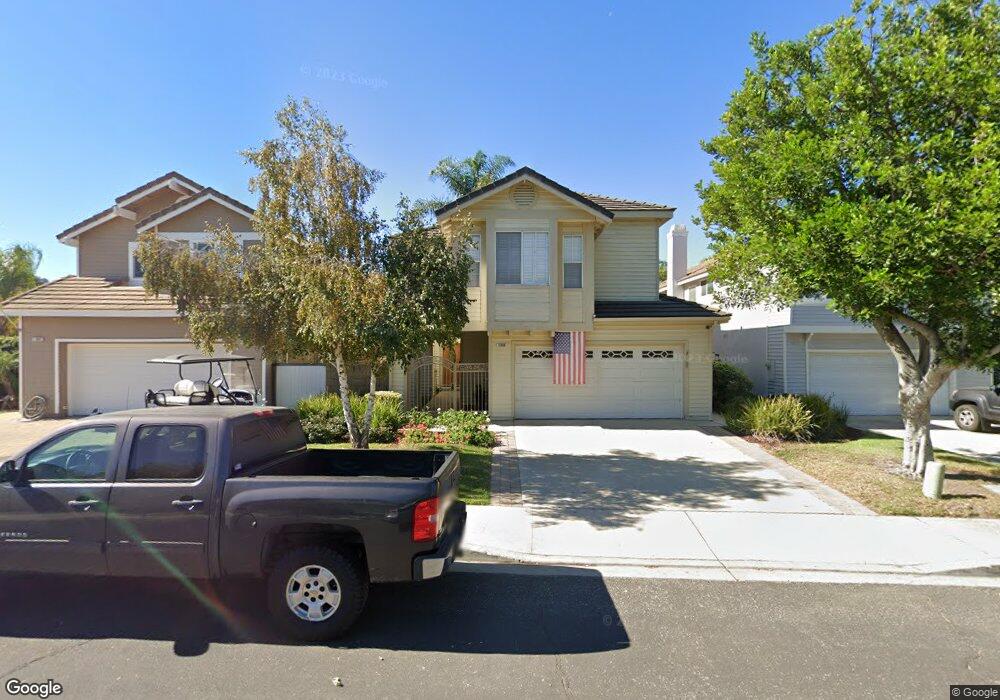
11800 Alderbrook St Moorpark, CA 93021
Estimated Value: $951,000 - $1,016,000
4
Beds
3
Baths
2,284
Sq Ft
$431/Sq Ft
Est. Value
About This Home
This home is located at 11800 Alderbrook St, Moorpark, CA 93021 and is currently estimated at $984,091, approximately $430 per square foot. 11800 Alderbrook St is a home located in Ventura County with nearby schools including Mountain Meadows Elementary School, Chaparral Middle School, and Moorpark High School.
Ownership History
Date
Name
Owned For
Owner Type
Purchase Details
Closed on
Feb 6, 2017
Sold by
Desautels Stephen M and Desautels Victoria A
Bought by
Desautels Stephen M and Desautels Victoria A
Current Estimated Value
Purchase Details
Closed on
Mar 24, 2003
Sold by
Desautels Stephen and Desautels Victoria A
Bought by
Desautels Stephen and Desautels Victoria A
Home Financials for this Owner
Home Financials are based on the most recent Mortgage that was taken out on this home.
Original Mortgage
$240,000
Outstanding Balance
$91,759
Interest Rate
4.37%
Estimated Equity
$892,332
Purchase Details
Closed on
Jul 31, 1997
Sold by
Loretta Kalan
Bought by
Desautels Stephen and Desautels Vicki
Home Financials for this Owner
Home Financials are based on the most recent Mortgage that was taken out on this home.
Original Mortgage
$186,800
Interest Rate
7.34%
Mortgage Type
Purchase Money Mortgage
Create a Home Valuation Report for This Property
The Home Valuation Report is an in-depth analysis detailing your home's value as well as a comparison with similar homes in the area
Home Values in the Area
Average Home Value in this Area
Purchase History
| Date | Buyer | Sale Price | Title Company |
|---|---|---|---|
| Desautels Stephen M | -- | None Available | |
| Desautels Stephen M | -- | None Available | |
| Desautels Stephen | -- | American Title Co | |
| Desautels Stephen | $117,000 | Fidelity National Title Co | |
| Desautels Stephen | $117,000 | Fidelity National Title Co |
Source: Public Records
Mortgage History
| Date | Status | Borrower | Loan Amount |
|---|---|---|---|
| Open | Desautels Stephen | $240,000 | |
| Closed | Desautels Stephen | $186,800 |
Source: Public Records
Tax History Compared to Growth
Tax History
| Year | Tax Paid | Tax Assessment Tax Assessment Total Assessment is a certain percentage of the fair market value that is determined by local assessors to be the total taxable value of land and additions on the property. | Land | Improvement |
|---|---|---|---|---|
| 2025 | $3,985 | $367,220 | $146,883 | $220,337 |
| 2024 | $3,985 | $360,020 | $144,003 | $216,017 |
| 2023 | $3,897 | $352,961 | $141,179 | $211,782 |
| 2022 | $3,797 | $346,041 | $138,411 | $207,630 |
| 2021 | $3,787 | $339,256 | $135,697 | $203,559 |
| 2020 | $3,752 | $335,779 | $134,306 | $201,473 |
| 2019 | $3,668 | $329,196 | $131,673 | $197,523 |
| 2018 | $3,630 | $322,742 | $129,092 | $193,650 |
| 2017 | $3,555 | $316,414 | $126,561 | $189,853 |
| 2016 | $3,488 | $310,211 | $124,080 | $186,131 |
| 2015 | $3,440 | $305,553 | $122,217 | $183,336 |
| 2014 | $3,348 | $299,570 | $119,824 | $179,746 |
Source: Public Records
Map
Nearby Homes
- 11928 River Grove Ct
- 11860 Alderbrook St
- 4196 Hillbrook Ct
- 4136 Brookcrest Ct
- 11657 Blossomwood Ct
- 11544 Treeview Ct
- 4153 Brookcrest Ct
- 11624 Blossomwood Ct
- 4130 Hillpark Ct
- 4133 Hillpark Ct
- 12401 Willow Forest Dr
- 4429 Summerglen Ct
- 3861 Hunter Crest Ct
- 3866 Hunter Crest Ct
- 12441 Beech Grove Ct
- 4101 Laurelview Dr
- 12490 Spring Creek Rd
- 4471 Skyglen Ct
- 12576 Cherry Grove St
- 12496 Arbor Hill St
- 11798 Alderbrook St
- 11802 Alderbrook St
- 11796 Alderbrook St
- 11794 Alderbrook St
- 11804 Alderbrook St
- 11803 Alderbrook St
- 11805 Alderbrook St
- 11801 Alderbrook St
- 4048 Brindisi Pl #27
- 4048 Brindisi Place
- 4046 Brindisi Place Unit 26
- 11799 Alderbrook St
- 11808 Alderbrook St
- 11797 Alderbrook St
- 4042 Brindisi Place
- 4054 Brindisi Place
- 11795 Alderbrook St
- 4036 Brindisi Place
- 11902 Honeybrook Ct
- 4056 Brindisi Place