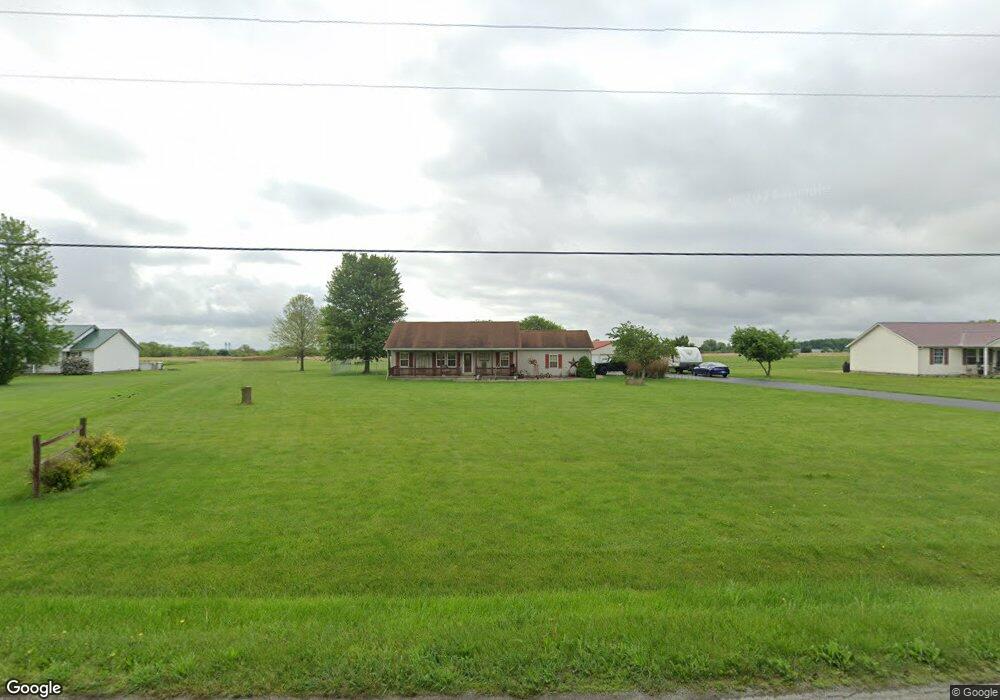
11802 Monroe Rd Leesburg, OH 45135
Estimated Value: $239,771 - $324,000
3
Beds
2
Baths
1,200
Sq Ft
$231/Sq Ft
Est. Value
About This Home
This home is located at 11802 Monroe Rd, Leesburg, OH 45135 and is currently estimated at $277,193, approximately $230 per square foot. 11802 Monroe Rd is a home located in Highland County with nearby schools including Fairfield Local Elementary School, Fairfield Local Middle School, and Fairfield Local High School.
Ownership History
Date
Name
Owned For
Owner Type
Purchase Details
Closed on
Jul 22, 2011
Sold by
Arnold Fred D and Arnold Janice S
Bought by
Anderson Jeffrey L and Anderson Jessica L
Current Estimated Value
Home Financials for this Owner
Home Financials are based on the most recent Mortgage that was taken out on this home.
Original Mortgage
$119,413
Interest Rate
4.54%
Mortgage Type
VA
Purchase Details
Closed on
Jun 18, 2010
Sold by
Ohio Homestead Group Llc
Bought by
Arnold Fred D and Arnold Janice S
Purchase Details
Closed on
Apr 20, 2010
Sold by
Gibson Billy J
Bought by
Ohio Homestead Group Llc
Purchase Details
Closed on
Nov 19, 1998
Sold by
Horst Margaret
Bought by
Bullock Bill J and Bullock Christina A
Home Financials for this Owner
Home Financials are based on the most recent Mortgage that was taken out on this home.
Original Mortgage
$68,100
Interest Rate
8%
Mortgage Type
New Conventional
Purchase Details
Closed on
Mar 25, 1998
Sold by
Back Francis
Bought by
Craycraft Ellis Back Donald
Create a Home Valuation Report for This Property
The Home Valuation Report is an in-depth analysis detailing your home's value as well as a comparison with similar homes in the area
Home Values in the Area
Average Home Value in this Area
Purchase History
| Date | Buyer | Sale Price | Title Company |
|---|---|---|---|
| Anderson Jeffrey L | $116,900 | Technetitle Agency | |
| Arnold Fred D | $106,000 | Attorney | |
| Ohio Homestead Group Llc | $69,000 | None Available | |
| Bullock Bill J | $85,150 | -- | |
| Craycraft Ellis Back Donald | $13,900 | -- |
Source: Public Records
Mortgage History
| Date | Status | Borrower | Loan Amount |
|---|---|---|---|
| Previous Owner | Anderson Jeffrey L | $119,413 | |
| Previous Owner | Bullock Bill J | $68,100 |
Source: Public Records
Tax History Compared to Growth
Tax History
| Year | Tax Paid | Tax Assessment Tax Assessment Total Assessment is a certain percentage of the fair market value that is determined by local assessors to be the total taxable value of land and additions on the property. | Land | Improvement |
|---|---|---|---|---|
| 2024 | $2,029 | $62,520 | $11,100 | $51,420 |
| 2023 | $2,029 | $49,040 | $9,700 | $39,340 |
| 2022 | $1,870 | $49,040 | $9,700 | $39,340 |
| 2021 | $1,873 | $49,040 | $9,700 | $39,340 |
| 2020 | $1,597 | $40,890 | $8,090 | $32,800 |
| 2019 | $1,578 | $40,890 | $8,090 | $32,800 |
| 2018 | $1,506 | $40,890 | $8,090 | $32,800 |
| 2017 | $1,429 | $36,860 | $9,420 | $27,440 |
| 2016 | $1,430 | $36,860 | $9,420 | $27,440 |
| 2015 | $1,565 | $36,860 | $9,420 | $27,440 |
| 2014 | $1,435 | $35,110 | $8,960 | $26,150 |
| 2013 | $1,438 | $35,110 | $8,960 | $26,150 |
Source: Public Records
Map
Nearby Homes
- 10491 Pausch Rd
- 10330 Pausch Rd
- 417 E Main St
- 204 Miller St
- 172 N Fairfield St
- 13370 Wyatt Falls Ct
- 0 Sabina Rd Unit 1857173
- 9439 Grimsley Rd
- 9363 Grimsley Rd
- Sabina Rd
- 12841 Sabina Rd
- 8581 Ruby Ln
- 12228 New Lexington Ave
- 7310 Limes Rd
- 7844 Church St
- 229 Fishback Rd
- 9581 State Route 138
- 6635 Limes Rd
- 8529 Ohio 72
- 10105 Us Rt 62
- 11802 Monroe Rd
- 11782 Monroe Rd
- 11822 Monroe Rd
- 12 Monroe Rd
- 10 Monroe Rd
- 11832 Monroe Rd
- 11762 Monroe Rd
- 11848 Monroe Rd
- 11746 Monroe Rd
- 11870 Monroe Rd
- 11730 Monroe Rd
- 11886 Monroe Rd
- 11694 Monroe Rd
- 11858 Monroe Rd
- 11676 Monroe Rd
- 11658 Monroe Rd
- 11660 Monroe Rd
- 10326 Centerfield Rd
- 10177 Centerfield Rd
- 10177 Centerfield Rd