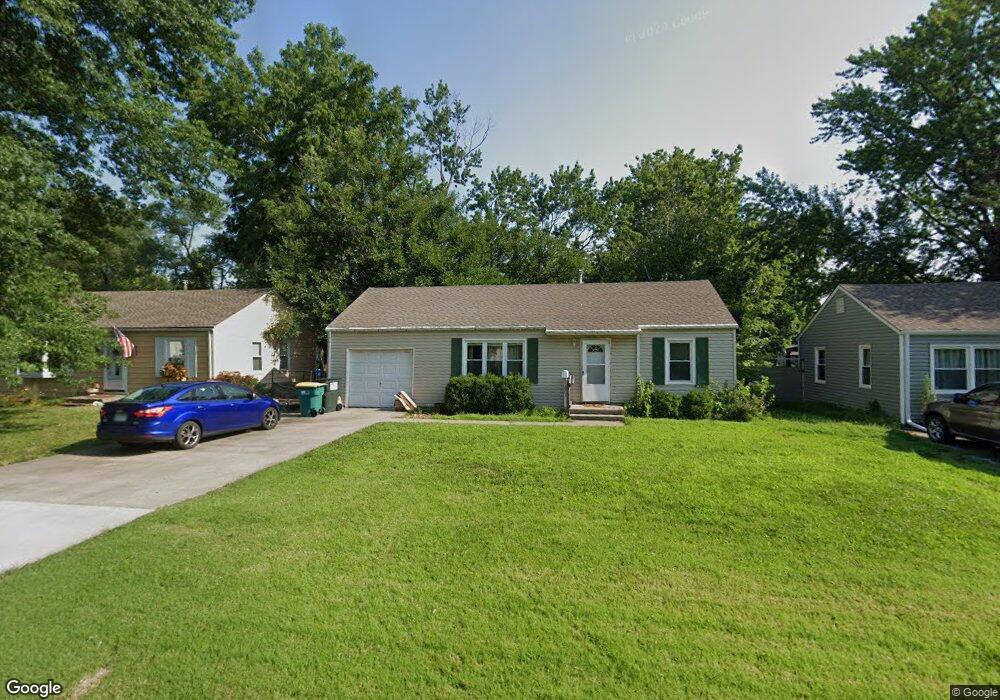
11802 W 69th Terrace Shawnee, KS 66203
Estimated Value: $255,000 - $290,000
2
Beds
1
Bath
1,008
Sq Ft
$268/Sq Ft
Est. Value
About This Home
This home is located at 11802 W 69th Terrace, Shawnee, KS 66203 and is currently estimated at $270,407, approximately $268 per square foot. 11802 W 69th Terrace is a home located in Johnson County with nearby schools including Nieman Elementary School, Hocker Grove Middle School, and Shawnee Mission North High School.
Ownership History
Date
Name
Owned For
Owner Type
Purchase Details
Closed on
Nov 19, 2021
Sold by
Parsons James M and Parsons Cindy D
Bought by
Greeley Christopher
Current Estimated Value
Home Financials for this Owner
Home Financials are based on the most recent Mortgage that was taken out on this home.
Original Mortgage
$170,000
Outstanding Balance
$155,668
Interest Rate
3.09%
Mortgage Type
New Conventional
Estimated Equity
$114,739
Purchase Details
Closed on
Apr 27, 2015
Sold by
Valentine Maurice E and Valentine Dona L
Bought by
Persons William M
Purchase Details
Closed on
Jun 10, 2002
Sold by
Millette Eugene A and Culberson Sherry J
Bought by
Valentine Maurice E and Valentine Dona L
Home Financials for this Owner
Home Financials are based on the most recent Mortgage that was taken out on this home.
Original Mortgage
$55,200
Interest Rate
6.77%
Create a Home Valuation Report for This Property
The Home Valuation Report is an in-depth analysis detailing your home's value as well as a comparison with similar homes in the area
Home Values in the Area
Average Home Value in this Area
Purchase History
| Date | Buyer | Sale Price | Title Company |
|---|---|---|---|
| Greeley Christopher | -- | None Available | |
| Persons William M | -- | Thomson Affinity Title Llc | |
| Valentine Maurice E | -- | Chicago Title Insurance Co |
Source: Public Records
Mortgage History
| Date | Status | Borrower | Loan Amount |
|---|---|---|---|
| Open | Greeley Christopher | $170,000 | |
| Previous Owner | Valentine Maurice E | $55,200 | |
| Closed | Valentine Maurice E | $6,900 |
Source: Public Records
Tax History Compared to Growth
Tax History
| Year | Tax Paid | Tax Assessment Tax Assessment Total Assessment is a certain percentage of the fair market value that is determined by local assessors to be the total taxable value of land and additions on the property. | Land | Improvement |
|---|---|---|---|---|
| 2024 | $2,857 | $27,301 | $4,896 | $22,405 |
| 2023 | $3,491 | $25,300 | $4,896 | $20,404 |
| 2022 | $3,036 | $22,367 | $4,272 | $18,095 |
| 2021 | $3,036 | $20,401 | $3,710 | $16,691 |
| 2020 | $2,183 | $18,699 | $3,374 | $15,325 |
| 2019 | $2,135 | $18,274 | $3,072 | $15,202 |
| 2018 | $1,855 | $15,789 | $2,800 | $12,989 |
| 2017 | $1,824 | $15,283 | $2,800 | $12,483 |
| 2016 | $1,614 | $13,328 | $2,800 | $10,528 |
| 2015 | $1,528 | $13,236 | $2,800 | $10,436 |
| 2013 | -- | $12,742 | $2,800 | $9,942 |
Source: Public Records
Map
Nearby Homes
- 11637 W 68th Terrace
- 7107 Garnett St
- 11406 W 71st St
- 11217 W 69th Terrace
- 12300 W 67th Terrace
- 6610 Halsey St
- 6564 Charles St
- 6556 Charles St
- 12403 W 72nd Terrace
- 10914 W 71st St
- 7130 Westgate St
- 12225 W 64th Terrace
- Augusta Plan at Kenneth Estates
- Newport Plan at Kenneth Estates
- Rosemount II Plan at Kenneth Estates
- The Avala Villa Plan at Kenneth Estates
- The Rosemount Villa Plan at Kenneth Estates
- Catalina II Plan at Kenneth Estates
- The Avala Plan at Kenneth Estates
- 12811 W 71st St
- 11724 W 69th Terrace
- 11806 W 69th Terrace
- 11720 W 69th Terrace
- 11814 W 69th Terrace
- 11801 W 69th St
- 11813 W 69th St
- 11716 W 69th Terrace
- 11801 W 69th Terrace
- 11820 W 69th Terrace
- 11807 W 69th Terrace
- 11715 W 69th St
- 11725 W 69th Terrace
- 11821 W 69th St
- 11815 W 69th Terrace
- 11721 W 69th Terrace
- 11708 W 69th Terrace
- 11821 W 69th Terrace
- 11715 W 69th Terrace
- 11713 W 69th St
- 11802 W 69th St