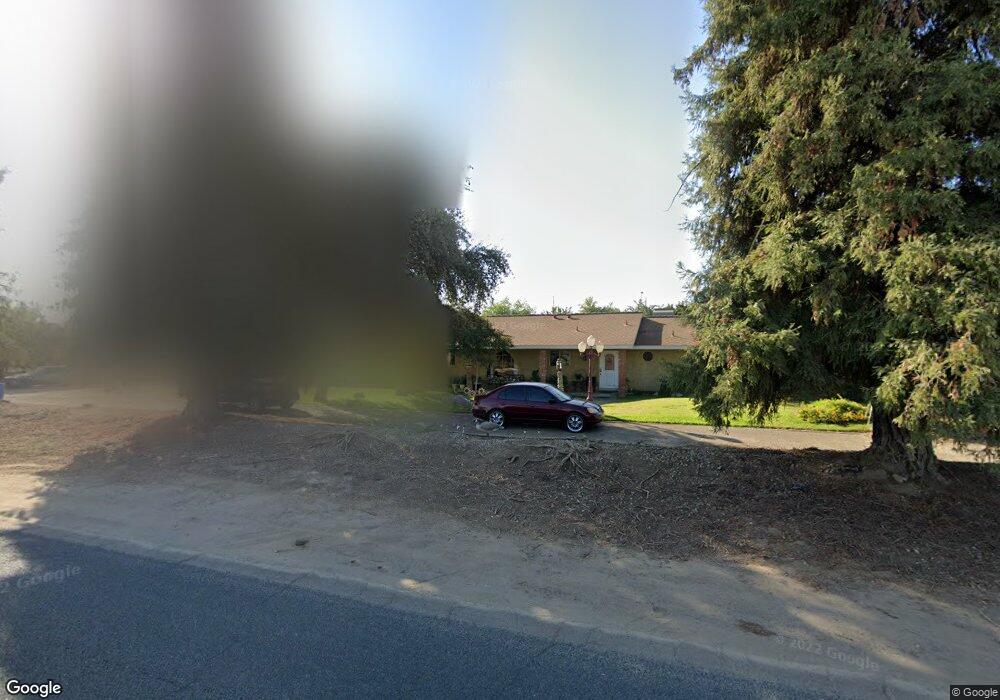
11803 Avenue 274 Visalia, CA 93277
Estimated Value: $413,178
3
Beds
2
Baths
1,708
Sq Ft
$242/Sq Ft
Est. Value
About This Home
This home is located at 11803 Avenue 274, Visalia, CA 93277 and is currently priced at $413,178, approximately $241 per square foot. 11803 Avenue 274 is a home located in Tulare County with nearby schools including Liberty Elementary School, Tulare Western High School, and Visalia Charter Independent Study - East Campus.
Ownership History
Date
Name
Owned For
Owner Type
Purchase Details
Closed on
Dec 8, 2021
Sold by
Bergman John F and Bergman Doris N
Bought by
Bergman Joshua J and Bergman Michelle R
Current Estimated Value
Purchase Details
Closed on
Dec 3, 2015
Sold by
Schuil Marc R
Bought by
Mineral King Investment Company Llc
Purchase Details
Closed on
Dec 11, 2014
Sold by
Guzman David R
Bought by
The Steve & Loretta Scheenstra Trust
Purchase Details
Closed on
Dec 21, 2010
Sold by
Castro Stanley E
Bought by
Guzman David R and Guzman Raquel
Home Financials for this Owner
Home Financials are based on the most recent Mortgage that was taken out on this home.
Original Mortgage
$165,000
Interest Rate
4.35%
Mortgage Type
Unknown
Purchase Details
Closed on
Oct 22, 1999
Sold by
Castro Stanley E
Bought by
Castro Stanley E and Castro Verna L
Purchase Details
Closed on
Aug 21, 1998
Sold by
Castro Stanley Edward
Bought by
Castro Verna
Create a Home Valuation Report for This Property
The Home Valuation Report is an in-depth analysis detailing your home's value as well as a comparison with similar homes in the area
Home Values in the Area
Average Home Value in this Area
Purchase History
| Date | Buyer | Sale Price | Title Company |
|---|---|---|---|
| Bergman Joshua J | $100,000 | Chicago Title Company | |
| Mineral King Investment Company Llc | -- | None Available | |
| The Steve & Loretta Scheenstra Trust | $205,000 | Chicago Title Company | |
| Guzman David R | $245,000 | Chicago Title Company | |
| Castro Stanley E | -- | -- | |
| Castro Verna | -- | First American Title Co |
Source: Public Records
Mortgage History
| Date | Status | Borrower | Loan Amount |
|---|---|---|---|
| Previous Owner | Guzman David R | $165,000 |
Source: Public Records
Tax History Compared to Growth
Tax History
| Year | Tax Paid | Tax Assessment Tax Assessment Total Assessment is a certain percentage of the fair market value that is determined by local assessors to be the total taxable value of land and additions on the property. | Land | Improvement |
|---|---|---|---|---|
| 2022 | $2,551 | $232,169 | $90,603 | $141,566 |
| 2021 | $2,494 | $227,616 | $88,826 | $138,790 |
| 2020 | $2,489 | $225,282 | $87,915 | $137,367 |
| 2019 | $2,451 | $220,865 | $86,191 | $134,674 |
| 2018 | $2,434 | $216,534 | $84,501 | $132,033 |
| 2017 | $2,438 | $212,288 | $82,844 | $129,444 |
| 2016 | $2,361 | $208,126 | $81,220 | $126,906 |
| 2015 | $2,341 | $205,000 | $80,000 | $125,000 |
| 2014 | $2,926 | $256,055 | $104,512 | $151,543 |
Source: Public Records
Map
Nearby Homes
- 27274 S Mooney Blvd
- 11590 Avenue 272
- 0 W Midvalley Ave
- 0 W Cameron Unit E1 233502
- 1635-1639 W Cameron Ave
- 2400 W Midvalley Ave
- 2400 W Midvalley Ave Unit S 1
- 2400 W Midvalley Ave Unit R6
- 2400 W Midvalley Ave Unit R5
- 2400 W Midvalley Ave Unit Ld44
- 2400 W Midvalley Ave Unit O6
- 2400 W Midvalley Ave Unit L3
- 2400 W Midvalley Ave Unit F-1
- 2400 W Midvalley Ave Unit O10
- 2627 W Midvalley Ave Unit 104
- 2627 W Midvalley Ave
- 2627 W Midvalley Ave Unit 46
- 2627 W Midvalley Ave Unit 10
- 2627 W Midvalley Ave Unit 125
- 2627 W Midvalley Spc 3 Ave
- 0 Avenue 274 Unit 202107290
- 0 Avenue 274 Unit 211973
- 0 Avenue 274 Unit 221080314
- 0 Avenue 274
- 11715 Avenue 274
- 11937 Avenue 274
- 11957 Avenue 274
- 11653 Avenue 274
- 11945 Avenue 274
- 11945 Avenue 274
- 11945 Avenue 274
- 11965 Avenue 274
- 11804 Avenue 272
- 11971 Avenue 274
- 11983 Avenue 274
- 11948 Avenue 272
- 4701 S Mooney Blvd Pepper 4
- 11992 Avenue 272
- 12033 Avenue 274
- 2200 W Midvalley Ave