
Landlord's Agent in 2016
Brown Pearson
Executives, Inc.
(804) 347-8895
12 Total Sales
Estimated Value: $224,972 - $234,000
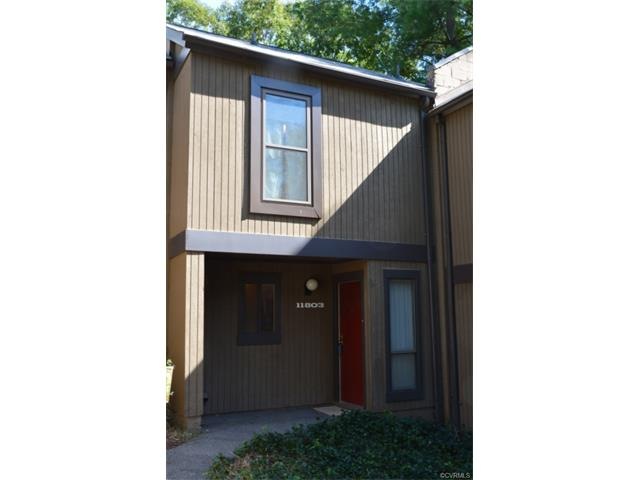
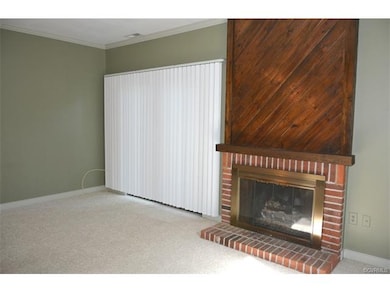
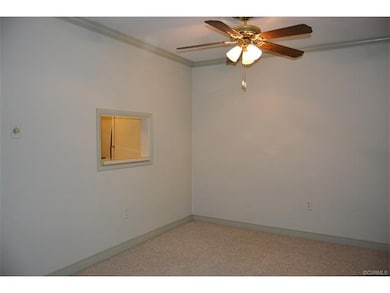
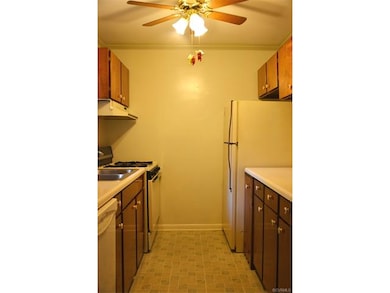
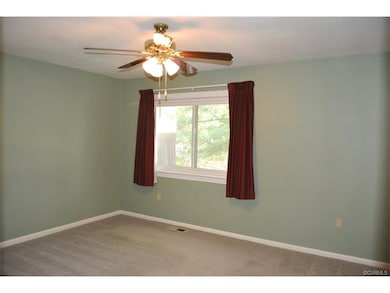
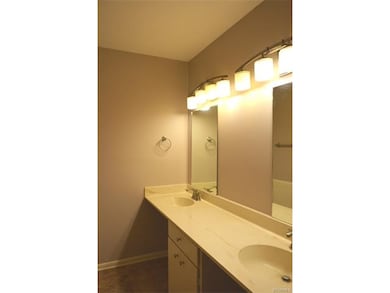
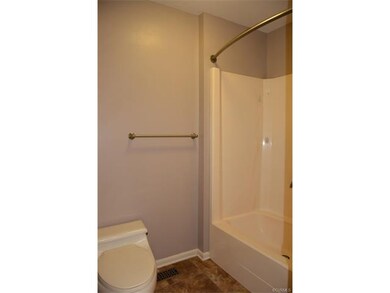
Available approx. 11-5-15, 11803 South Briar Patch Drive is a beautiful two story condominium located in the Midlothian area of Chesterfield County. This 1164 square foot home features 2 bedrooms, 1.5 baths, a formal dining room, a family room with a fireplace, and a kitchen with gas range, refrigerator, and dishwasher. Other amenities include a shaded rear patio that’s perfect for relaxing or entertaining friends and family, a utility closet with washer and dryer provided, an exterior storage shed, and a pull-down attic for additional storage. Water, sewer, gas, and trash collection as well as access to the community pool are all included in the rent amount. This home utilizes gas heat and central air conditioning for year round comfort. Total security deposit may be equal to one months rent or two months rent depending on any applicable qualification criteria. Please call our office for details.
Last Agent to Rent the Property
Executives, Inc. License #0225022050 Listed on: 09/17/2015
| Date | Buyer | Sale Price | Title Company |
|---|---|---|---|
| Fincher Benjamin K | $139,000 | Day Title Services Lc | |
| Bradshaw F K | $85,950 | -- |
| Date | Status | Borrower | Loan Amount |
|---|---|---|---|
| Previous Owner | Fincher Benjamin K | $89,000 |
| Date | Event | Price | List to Sale | Price per Sq Ft |
|---|---|---|---|---|
| 01/15/2016 01/15/16 | Rented | $925 | -14.0% | -- |
| 12/16/2015 12/16/15 | Under Contract | -- | -- | -- |
| 09/17/2015 09/17/15 | For Rent | $1,075 | +2.4% | -- |
| 10/10/2014 10/10/14 | Rented | $1,050 | -8.7% | -- |
| 10/10/2014 10/10/14 | For Rent | $1,150 | -- | -- |
| Year | Tax Paid | Tax Assessment Tax Assessment Total Assessment is a certain percentage of the fair market value that is determined by local assessors to be the total taxable value of land and additions on the property. | Land | Improvement |
|---|---|---|---|---|
| 2025 | $1,815 | $203,100 | $52,000 | $151,100 |
| 2024 | $1,815 | $185,600 | $39,000 | $146,600 |
| 2023 | $1,414 | $155,400 | $34,000 | $121,400 |
| 2022 | $1,363 | $148,200 | $32,000 | $116,200 |
| 2021 | $1,297 | $135,700 | $30,000 | $105,700 |
| 2020 | $1,245 | $131,000 | $30,000 | $101,000 |
| 2019 | $1,199 | $126,200 | $29,000 | $97,200 |
| 2018 | $1,118 | $121,800 | $28,000 | $93,800 |
| 2017 | $1,071 | $110,800 | $26,000 | $84,800 |
| 2016 | $1,017 | $105,900 | $25,000 | $80,900 |
| 2015 | $1,022 | $106,500 | $25,000 | $81,500 |
| 2014 | $896 | $93,300 | $20,500 | $72,800 |
Landlord's Agent in 2016
Brown Pearson
Executives, Inc.
(804) 347-8895
12 Total Sales
Source: Central Virginia Regional MLS
MLS Number: 1526195
APN: 738-71-34-37-200-039
Disclaimer: Certain information contained herein is derived from information provided by parties other than Homes.com. All information provided is deemed reliable, but is not guaranteed to be accurate and should be independently verified.
![]() All or a portion of th multiple Listing information is provided by the Central Virginia Regional Multiple Listing Service, LLC, from a copyrighted compilation of Listing s. All CVR MLS information provided is deemed reliable but is not guaranteed accurate. The compilation of Listings and each individual Listing are ©2026 Central Virginia Regional Multiple Listing Service, LLC. All rights reserved.
All or a portion of th multiple Listing information is provided by the Central Virginia Regional Multiple Listing Service, LLC, from a copyrighted compilation of Listing s. All CVR MLS information provided is deemed reliable but is not guaranteed accurate. The compilation of Listings and each individual Listing are ©2026 Central Virginia Regional Multiple Listing Service, LLC. All rights reserved.
Ask me questions while you tour the home.