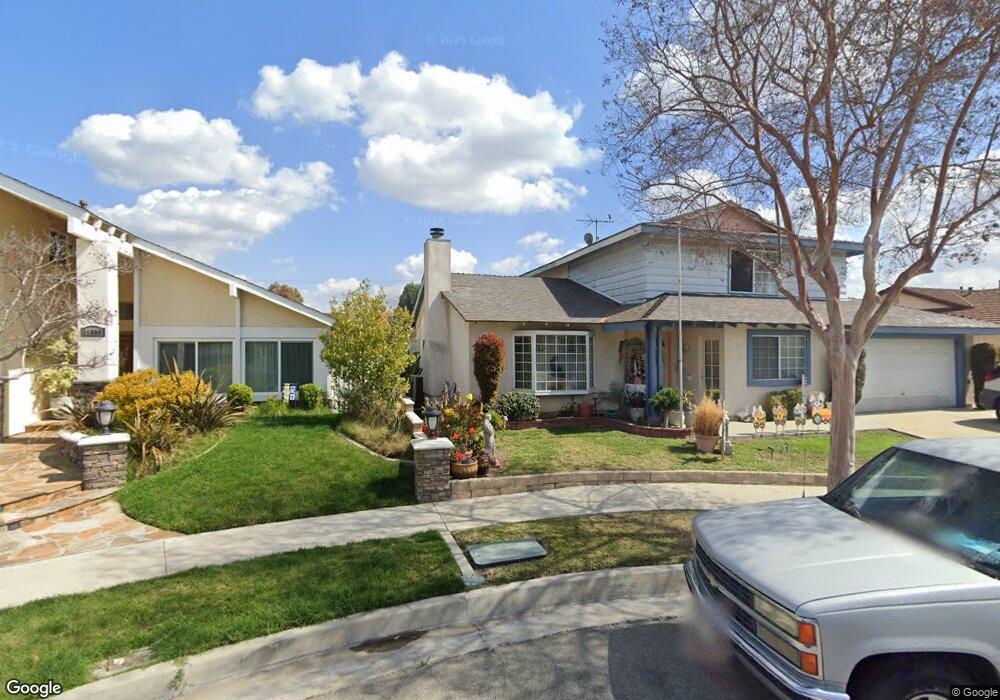
11804 La Cima Dr Whittier, CA 90604
East Whittier NeighborhoodEstimated Value: $928,000 - $1,014,579
5
Beds
3
Baths
2,269
Sq Ft
$425/Sq Ft
Est. Value
About This Home
This home is located at 11804 La Cima Dr, Whittier, CA 90604 and is currently estimated at $964,645, approximately $425 per square foot. 11804 La Cima Dr is a home located in Los Angeles County with nearby schools including Scott Avenue Elementary School, Granada Middle School, and La Serna High School.
Ownership History
Date
Name
Owned For
Owner Type
Purchase Details
Closed on
May 19, 2025
Sold by
Furiani Ophelia P
Bought by
Ophelia Furiani 2025 Trust and Furiani
Current Estimated Value
Purchase Details
Closed on
Mar 26, 2002
Sold by
Trost Jerome C and Trost Cynthia G
Bought by
Furiani Ophelia P
Home Financials for this Owner
Home Financials are based on the most recent Mortgage that was taken out on this home.
Original Mortgage
$220,000
Interest Rate
6.78%
Purchase Details
Closed on
Sep 30, 1994
Sold by
Ba Properties Inc
Bought by
Trost Jerome C
Home Financials for this Owner
Home Financials are based on the most recent Mortgage that was taken out on this home.
Original Mortgage
$198,500
Interest Rate
8.5%
Purchase Details
Closed on
Jun 15, 1994
Sold by
Statewide Lenders Services Inc
Bought by
Ba Properties Inc
Create a Home Valuation Report for This Property
The Home Valuation Report is an in-depth analysis detailing your home's value as well as a comparison with similar homes in the area
Home Values in the Area
Average Home Value in this Area
Purchase History
| Date | Buyer | Sale Price | Title Company |
|---|---|---|---|
| Ophelia Furiani 2025 Trust | -- | None Listed On Document | |
| Furiani Ophelia P | $275,000 | American Title Co | |
| Trost Jerome C | $209,000 | Old Republic Title Company | |
| Ba Properties Inc | $49,099 | Stewart Title |
Source: Public Records
Mortgage History
| Date | Status | Borrower | Loan Amount |
|---|---|---|---|
| Previous Owner | Furiani Ophelia P | $220,000 | |
| Previous Owner | Trost Jerome C | $198,500 |
Source: Public Records
Tax History
| Year | Tax Paid | Tax Assessment Tax Assessment Total Assessment is a certain percentage of the fair market value that is determined by local assessors to be the total taxable value of land and additions on the property. | Land | Improvement |
|---|---|---|---|---|
| 2025 | $5,094 | $406,235 | $246,255 | $159,980 |
| 2024 | $5,094 | $398,271 | $241,427 | $156,844 |
| 2023 | $5,009 | $390,463 | $236,694 | $153,769 |
| 2022 | $4,902 | $382,807 | $232,053 | $150,754 |
| 2021 | $4,800 | $375,302 | $227,503 | $147,799 |
| 2019 | $4,704 | $364,172 | $220,756 | $143,416 |
| 2018 | $4,537 | $357,032 | $216,428 | $140,604 |
| 2016 | $4,285 | $343,171 | $208,025 | $135,146 |
| 2015 | $4,258 | $338,017 | $204,901 | $133,116 |
| 2014 | $4,202 | $331,397 | $200,888 | $130,509 |
Source: Public Records
Map
Nearby Homes
- 15330 Saranac Dr
- 15503 Woodcrest Dr
- 11245 Gladhill Rd Unit 10
- 15230 Weeks Dr
- 11237 Gladhill Rd Unit 12
- 11237 Gladhill Rd Unit 8
- 11237 Gladhill Rd Unit 3
- 11237 Gladhill Rd Unit 7
- 11237 Gladhill Rd Unit 2
- 15246 Mystic St
- 15216 Mccann Place
- 15814 Sharonhill Dr
- 12203 Santa Gertrudes Ave Unit 64
- 11128 Stamy Rd
- 11020 El Arco Dr
- 11514 Mollyknoll Ave
- 16005 Willows Ct
- 10836 Mayes Dr
- 16036 Richvale Dr
- 16061 Amber Valley Dr
- 11810 La Cima Dr
- 11800 La Cima Dr
- 11805 Scott Ave
- 11811 Scott Ave
- 11801 Scott Ave
- 11816 La Cima Dr
- 11817 Scott Ave
- 11805 La Cima Dr
- 11801 La Cima Dr
- 11811 La Cima Dr
- 11822 La Cima Dr
- 11817 La Cima Dr
- 11823 Scott Ave
- 11823 La Cima Dr
- 11828 La Cima Dr
- 11804 La Serna Dr
- 11806 Scott Ave
- 11829 Scott Ave
- 11810 La Serna Dr
- 11800 La Serna Dr
Your Personal Tour Guide
Ask me questions while you tour the home.