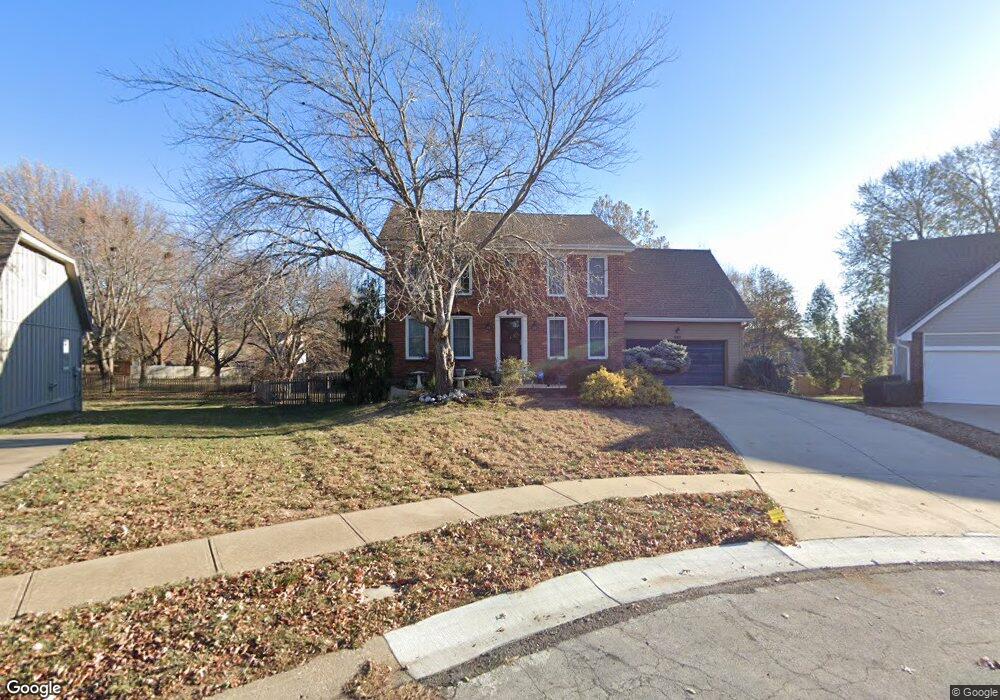
11805 Hemlock St Overland Park, KS 66210
Central Overland Park NeighborhoodEstimated Value: $492,000 - $546,000
4
Beds
4
Baths
2,546
Sq Ft
$203/Sq Ft
Est. Value
About This Home
This home is located at 11805 Hemlock St, Overland Park, KS 66210 and is currently estimated at $516,306, approximately $202 per square foot. 11805 Hemlock St is a home located in Johnson County with nearby schools including Valley Park Elementary School, Overland Trail Middle School, and Blue Valley North High School.
Ownership History
Date
Name
Owned For
Owner Type
Purchase Details
Closed on
Jul 11, 2013
Sold by
Clark Janet D
Bought by
Hamidjaja Linda
Current Estimated Value
Home Financials for this Owner
Home Financials are based on the most recent Mortgage that was taken out on this home.
Original Mortgage
$239,400
Outstanding Balance
$54,062
Interest Rate
3.08%
Mortgage Type
New Conventional
Estimated Equity
$462,244
Purchase Details
Closed on
Oct 8, 2011
Sold by
Bradshaw Tara B
Bought by
Clark Janet D
Home Financials for this Owner
Home Financials are based on the most recent Mortgage that was taken out on this home.
Original Mortgage
$227,891
Interest Rate
3.3%
Mortgage Type
FHA
Purchase Details
Closed on
Jul 15, 2009
Sold by
Kemp Sherran
Bought by
Clark Janet D and Bradshaw Tara B
Home Financials for this Owner
Home Financials are based on the most recent Mortgage that was taken out on this home.
Original Mortgage
$232,215
Interest Rate
5.39%
Mortgage Type
FHA
Purchase Details
Closed on
Mar 19, 2006
Sold by
Kemp Paul W
Bought by
Kemp Sherran
Create a Home Valuation Report for This Property
The Home Valuation Report is an in-depth analysis detailing your home's value as well as a comparison with similar homes in the area
Home Values in the Area
Average Home Value in this Area
Purchase History
| Date | Buyer | Sale Price | Title Company |
|---|---|---|---|
| Hamidjaja Linda | -- | None Available | |
| Clark Janet D | -- | All American Title Company | |
| Clark Janet D | -- | First American Title Ins Co | |
| Kemp Sherran | -- | None Available |
Source: Public Records
Mortgage History
| Date | Status | Borrower | Loan Amount |
|---|---|---|---|
| Open | Hamidjaja Linda | $239,400 | |
| Previous Owner | Clark Janet D | $227,891 | |
| Previous Owner | Clark Janet D | $232,215 |
Source: Public Records
Tax History Compared to Growth
Tax History
| Year | Tax Paid | Tax Assessment Tax Assessment Total Assessment is a certain percentage of the fair market value that is determined by local assessors to be the total taxable value of land and additions on the property. | Land | Improvement |
|---|---|---|---|---|
| 2024 | $5,659 | $55,281 | $11,238 | $44,043 |
| 2023 | $5,086 | $48,887 | $11,238 | $37,649 |
| 2022 | $4,633 | $43,758 | $11,238 | $32,520 |
| 2021 | $4,532 | $40,572 | $8,325 | $32,247 |
| 2020 | $4,593 | $40,848 | $7,572 | $33,276 |
| 2019 | $4,566 | $39,744 | $5,044 | $34,700 |
| 2018 | $4,425 | $37,755 | $5,044 | $32,711 |
| 2017 | $4,137 | $34,684 | $5,044 | $29,640 |
| 2016 | $3,817 | $31,982 | $5,044 | $26,938 |
| 2015 | $3,599 | $30,050 | $5,044 | $25,006 |
| 2013 | -- | $26,922 | $5,044 | $21,878 |
Source: Public Records
Map
Nearby Homes
- 11838 Mackey St
- 11721 Craig St
- 12031 Hemlock St
- 8028 W 116th St
- 7861 W 118th Terrace
- 12044 Mackey St
- 12103 Slater St
- 11920 Grandview St
- 11504 Newton St
- 9024 W 121st Terrace
- 11447 Craig St
- 12229 Goodman St
- 9001 W 121st Terrace
- 8031 W 122nd Terrace
- 9417 W 120th St
- 11316 Hemlock St
- 9013 W 115th St
- 8712 W 113th St
- 8500 W 113th St
- 12313 England St
- 11801 Hemlock St
- 11809 Hemlock St
- 11818 Hardy St
- 11741 Hemlock St
- 11822 Hardy St
- 11814 Hardy St
- 11813 Hemlock St
- 11810 Hardy St
- 11737 Hemlock St
- 11817 Hemlock St
- 11826 Hardy St
- 11806 Hardy St
- 8301 W 118th St
- 11733 Hemlock St
- 11830 Hardy St
- 11802 Hardy St
- 11734 Hemlock St
- 11845 Mackey St
- 11813 Hardy St
- 11729 Hemlock St