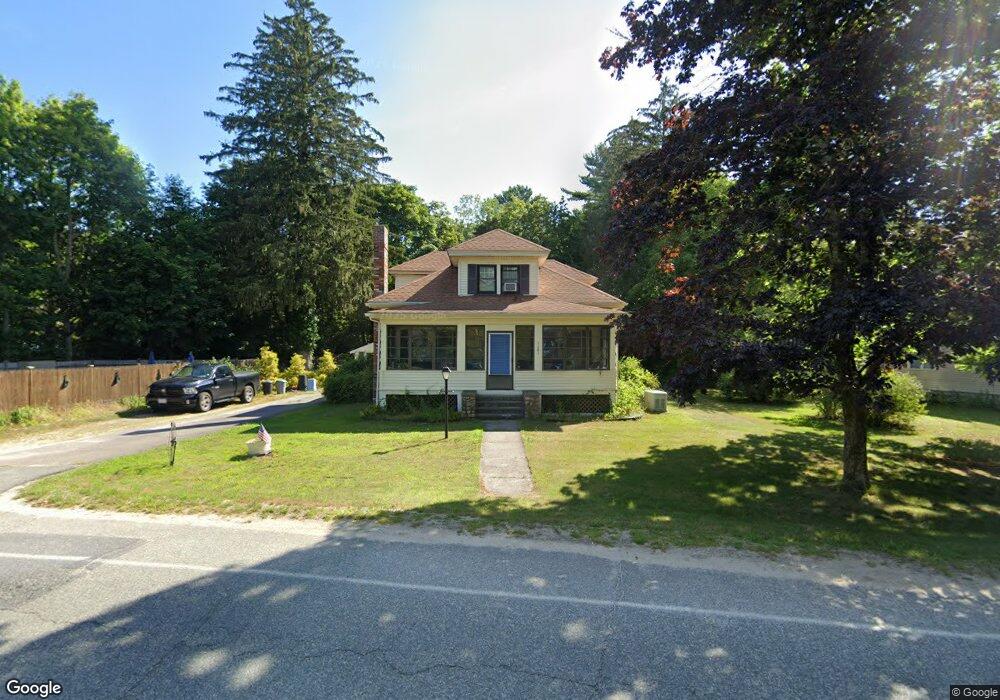
1181 Main St West Wareham, MA 02576
Estimated Value: $482,267 - $536,000
3
Beds
1
Bath
1,685
Sq Ft
$300/Sq Ft
Est. Value
About This Home
This home is located at 1181 Main St, West Wareham, MA 02576 and is currently estimated at $506,067, approximately $300 per square foot. 1181 Main St is a home located in Plymouth County.
Ownership History
Date
Name
Owned For
Owner Type
Purchase Details
Closed on
Jun 25, 1993
Sold by
Fernandes Mary
Bought by
Wallace Irving I
Current Estimated Value
Home Financials for this Owner
Home Financials are based on the most recent Mortgage that was taken out on this home.
Original Mortgage
$112,100
Interest Rate
7.37%
Mortgage Type
Purchase Money Mortgage
Create a Home Valuation Report for This Property
The Home Valuation Report is an in-depth analysis detailing your home's value as well as a comparison with similar homes in the area
Home Values in the Area
Average Home Value in this Area
Purchase History
| Date | Buyer | Sale Price | Title Company |
|---|---|---|---|
| Wallace Irving I | $118,000 | -- | |
| Wallace Irving I | $118,000 | -- |
Source: Public Records
Mortgage History
| Date | Status | Borrower | Loan Amount |
|---|---|---|---|
| Open | Wallace Irving I | $101,000 | |
| Closed | Wallace Irving I | $112,100 |
Source: Public Records
Tax History Compared to Growth
Tax History
| Year | Tax Paid | Tax Assessment Tax Assessment Total Assessment is a certain percentage of the fair market value that is determined by local assessors to be the total taxable value of land and additions on the property. | Land | Improvement |
|---|---|---|---|---|
| 2025 | $4,575 | $439,100 | $112,300 | $326,800 |
| 2024 | $4,618 | $411,200 | $88,500 | $322,700 |
| 2023 | $4,123 | $375,300 | $80,400 | $294,900 |
| 2022 | $4,123 | $312,800 | $80,400 | $232,400 |
| 2021 | $3,789 | $281,700 | $80,400 | $201,300 |
| 2020 | $3,627 | $273,500 | $80,400 | $193,100 |
| 2019 | $3,409 | $256,500 | $80,000 | $176,500 |
| 2018 | $3,154 | $231,400 | $80,000 | $151,400 |
| 2017 | $3,112 | $231,400 | $80,000 | $151,400 |
| 2016 | $2,918 | $215,700 | $80,000 | $135,700 |
| 2015 | $2,777 | $212,500 | $80,000 | $132,500 |
| 2014 | $2,844 | $221,300 | $76,000 | $145,300 |
Source: Public Records
Map
Nearby Homes
- 563 County Rd
- 2230 Cranberry Hwy Unit 1
- 47 Weaver St
- 72 Papermill Rd Unit 72
- 20 Gault Rd
- 51 Crest Dr
- 11 Fonseca Way
- 103 Castle Dr
- 11 Acoaxet Ln
- 7 Forbes Rd
- 27 Siesta Dr
- 41 Longboat Rd
- 663 Wareham St Unit 8
- 663 Wareham St Unit 6
- 46 Helen St
- 59 Timber Ln
- 87 Great Hill Dr
- 664 Wareham St
- 9 White Pine Ave
- 189 Pine View Terrace