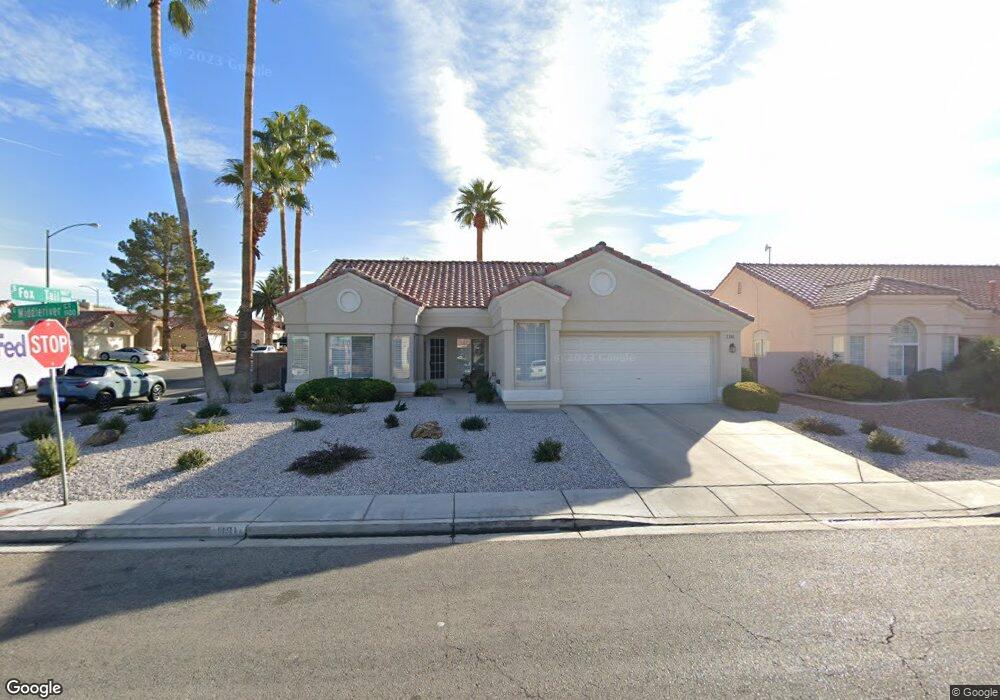
1181 Middleriver Ct Las Vegas, NV 89123
Silverado Ranch NeighborhoodEstimated Value: $489,000 - $513,000
4
Beds
2
Baths
1,812
Sq Ft
$277/Sq Ft
Est. Value
About This Home
This home is located at 1181 Middleriver Ct, Las Vegas, NV 89123 and is currently estimated at $501,196, approximately $276 per square foot. 1181 Middleriver Ct is a home located in Clark County with nearby schools including Louis Wiener Jr Elementary School, Charlotte Hill Elementary School, and Jack Lund Schofield Middle School.
Ownership History
Date
Name
Owned For
Owner Type
Purchase Details
Closed on
Apr 11, 2007
Sold by
Maynes Bruce W and Maynes Nancy I
Bought by
Maynes Bruce W and Maynes Nancy I
Current Estimated Value
Purchase Details
Closed on
Aug 13, 1999
Sold by
Luebber David K and Luebber Sharon J
Bought by
Maynes Bruce W and Maynes Nancy I
Home Financials for this Owner
Home Financials are based on the most recent Mortgage that was taken out on this home.
Original Mortgage
$60,000
Outstanding Balance
$17,215
Interest Rate
7.63%
Estimated Equity
$483,981
Purchase Details
Closed on
Jan 13, 1995
Sold by
Grigg Martin L and Grigg Lynda L
Bought by
Luebber David K and Luebber Sharon J
Home Financials for this Owner
Home Financials are based on the most recent Mortgage that was taken out on this home.
Original Mortgage
$135,900
Interest Rate
9.21%
Create a Home Valuation Report for This Property
The Home Valuation Report is an in-depth analysis detailing your home's value as well as a comparison with similar homes in the area
Home Values in the Area
Average Home Value in this Area
Purchase History
| Date | Buyer | Sale Price | Title Company |
|---|---|---|---|
| Maynes Bruce W | -- | None Available | |
| Maynes Bruce W | $170,000 | Fidelity National Title | |
| Luebber David K | $151,000 | Land Title |
Source: Public Records
Mortgage History
| Date | Status | Borrower | Loan Amount |
|---|---|---|---|
| Open | Maynes Bruce W | $60,000 | |
| Previous Owner | Luebber David K | $135,900 |
Source: Public Records
Tax History Compared to Growth
Tax History
| Year | Tax Paid | Tax Assessment Tax Assessment Total Assessment is a certain percentage of the fair market value that is determined by local assessors to be the total taxable value of land and additions on the property. | Land | Improvement |
|---|---|---|---|---|
| 2025 | $2,023 | $102,445 | $39,550 | $62,895 |
| 2024 | $1,965 | $102,445 | $39,550 | $62,895 |
| 2023 | $1,585 | $93,645 | $33,600 | $60,045 |
| 2022 | $1,908 | $87,913 | $32,550 | $55,363 |
| 2021 | $1,852 | $85,534 | $32,550 | $52,984 |
| 2020 | $1,796 | $76,684 | $23,800 | $52,884 |
| 2019 | $1,774 | $75,468 | $23,100 | $52,368 |
| 2018 | $1,692 | $69,887 | $19,250 | $50,637 |
| 2017 | $2,046 | $69,771 | $18,200 | $51,571 |
| 2016 | $1,585 | $64,552 | $12,600 | $51,952 |
| 2015 | $1,581 | $59,596 | $10,150 | $49,446 |
| 2014 | $1,535 | $50,777 | $8,750 | $42,027 |
Source: Public Records
Map
Nearby Homes
- 8190 Fox Tail Way
- 8272 Beaverbrook Way
- 1081 Overture Dr
- 8343 Rockefeller St
- 1077 Adelman Dr
- 8379 Drop Camp St
- 8378 Green Cedar Dr
- 915 Brass Ring Rd
- 0 S Maryland Pkwy
- 8039 Aspendale Dr
- 8031 Aspendale Dr
- 1058 Silver Stone Way Unit 3
- 899 Hornbeak Ct
- 920 Serpentina Ave
- 960 Clear Diamond Ave
- 7951 Aspendale Dr
- 8208 Palmada Dr
- 887 Centaur Ave
- 8138 Palmada Dr
- 920 Clear Diamond Ave
- 1171 Middleriver Ct
- 1171 Middleriver Ct
- 1182 Pelican Lake Ln
- 1172 Pelican Lake Ln
- 8170 Fox Tail Way
- 1161 Middleriver Ct
- 8180 Fox Tail Way
- 8160 Fox Tail Way
- 1180 Middleriver Ct
- 1170 Middleriver Ct
- 1162 Pelican Lake Ln
- 8150 Fox Tail Way
- 1151 Middleriver Ct
- 1160 Middleriver Ct
- 8210 Fox Tail Way
- 8140 Fox Tail Way
- 1152 Pelican Lake Ln
- 1150 Middleriver Ct
- 1181 Sleetridge Dr
- 1183 Pelican Lake Ln