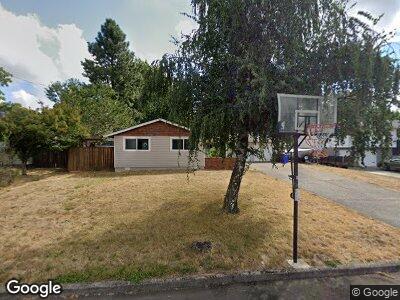
1181 Netzel St Oregon City, OR 97045
South End NeighborhoodEstimated Value: $458,000 - $501,000
3
Beds
2
Baths
1,155
Sq Ft
$415/Sq Ft
Est. Value
About This Home
This home is located at 1181 Netzel St, Oregon City, OR 97045 and is currently estimated at $478,882, approximately $414 per square foot. 1181 Netzel St is a home located in Clackamas County with nearby schools including John McLoughlin Elementary School, Gardiner Middle School, and Oregon City Senior High School.
Ownership History
Date
Name
Owned For
Owner Type
Purchase Details
Closed on
Dec 13, 2011
Sold by
Robertson Steve A
Bought by
Langeliers Shannon B
Current Estimated Value
Home Financials for this Owner
Home Financials are based on the most recent Mortgage that was taken out on this home.
Original Mortgage
$151,557
Outstanding Balance
$104,264
Interest Rate
3.75%
Mortgage Type
FHA
Estimated Equity
$374,618
Purchase Details
Closed on
May 14, 2002
Sold by
Seeholzer Clemens and Seeholzer Rose
Bought by
Robertson Steve A
Home Financials for this Owner
Home Financials are based on the most recent Mortgage that was taken out on this home.
Original Mortgage
$124,000
Interest Rate
7.13%
Purchase Details
Closed on
Jul 11, 1997
Sold by
Little Tami K and Little Steven D
Bought by
Seeholzer Clemens and Seeholzer Rose
Create a Home Valuation Report for This Property
The Home Valuation Report is an in-depth analysis detailing your home's value as well as a comparison with similar homes in the area
Home Values in the Area
Average Home Value in this Area
Purchase History
| Date | Buyer | Sale Price | Title Company |
|---|---|---|---|
| Langeliers Shannon B | $155,500 | Fidelity National Title Or | |
| Robertson Steve A | $155,000 | Pacific Nw Title | |
| Seeholzer Clemens | $150,500 | First American Title Ins Co |
Source: Public Records
Mortgage History
| Date | Status | Borrower | Loan Amount |
|---|---|---|---|
| Open | Langeliers Shannon B | $20,000 | |
| Open | Langeliers Shannon B | $151,557 | |
| Previous Owner | Robertson Steve A | $124,000 |
Source: Public Records
Tax History Compared to Growth
Tax History
| Year | Tax Paid | Tax Assessment Tax Assessment Total Assessment is a certain percentage of the fair market value that is determined by local assessors to be the total taxable value of land and additions on the property. | Land | Improvement |
|---|---|---|---|---|
| 2023 | $4,451 | $230,883 | $0 | $0 |
| 2022 | $4,096 | $224,159 | $0 | $0 |
| 2021 | $3,931 | $217,631 | $0 | $0 |
| 2020 | $3,819 | $211,293 | $0 | $0 |
| 2019 | $3,738 | $205,139 | $0 | $0 |
| 2018 | $3,552 | $199,164 | $0 | $0 |
| 2017 | $3,460 | $193,363 | $0 | $0 |
| 2016 | $3,397 | $187,731 | $0 | $0 |
| 2015 | $3,311 | $182,263 | $0 | $0 |
| 2014 | $3,217 | $176,954 | $0 | $0 |
Source: Public Records
Map
Nearby Homes
- 0 S End Rd
- 11862 Cornerstone Place
- 19319 Towercrest Dr
- 18450 Shadow Ridge Way
- 18721 Boynton St
- 1224 Lafayette Ave
- 11739 Long Standing Ct
- 18888 Highland Dr
- 18843 Hein St
- 18890 Highland Dr
- 19256 Rose Rd
- 19268 Rose Rd
- 11517 Shelby Rose Dr
- 18930 Highland Dr
- 18915 Allegheny Dr
- 532 Hartke Loop
- 18998 Shenandoah Dr
- 408 Barker Ave
- 134 Canemah Ct
- 12367 Hampton Dr